Key Takeaways
- LLMs cite AI-written content far more than human-edited content: But only once you look at the right pages. Among editorial pages (blogs, guides, glossaries), 71% of LLM-referred sessions landed on purely AI-generated content.
- The "57% human-edited" stat is misleading: That number is dominated by homepage traffic, where LLMs send users after recommending a product, not because they preferred the writing. Homepages skew heavily human-edited, which distorts the overall figure.
- Comparison and pricing pages are the exception: These are the only formats where human-edited pages hold their own (57% AI vs. 43% human-edited). Every other format sits between 75% and 92% AI-cited. If you're going to invest editor time anywhere, these pages are it.
- Gemini behaves differently from other LLMs: Claude, ChatGPT, and Perplexity all cite AI content at roughly 70–74%. Gemini is 10 points lower at 61%, suggesting it weighs human editing more heavily in its citation decisions.
- Perplexity sends the most traffic to editorial content: 27% of Perplexity's referred sessions land on blogs and guides, compared to 18% for ChatGPT. If you want LLM traffic hitting your actual content and not just your homepage, Perplexity is the channel to watch.
Three different client calls in the last quarter ended at the same line: "We're slowing down AI-led publishing because the consensus is LLMs penalize it." Same wording, three different companies. The internal logic in each room was identical. The Pure-AI share of citations had to be tiny. The LLMs had to be rewarding the human edit pass. The roadmap had to slow down.
We had the data to check whether the consensus held. 100+ B2B SaaS clients on the books, full GA4 access on every property, a quarterly AI-content detector pass across every URL pulling LLM referrals.
So we ran the numbers.
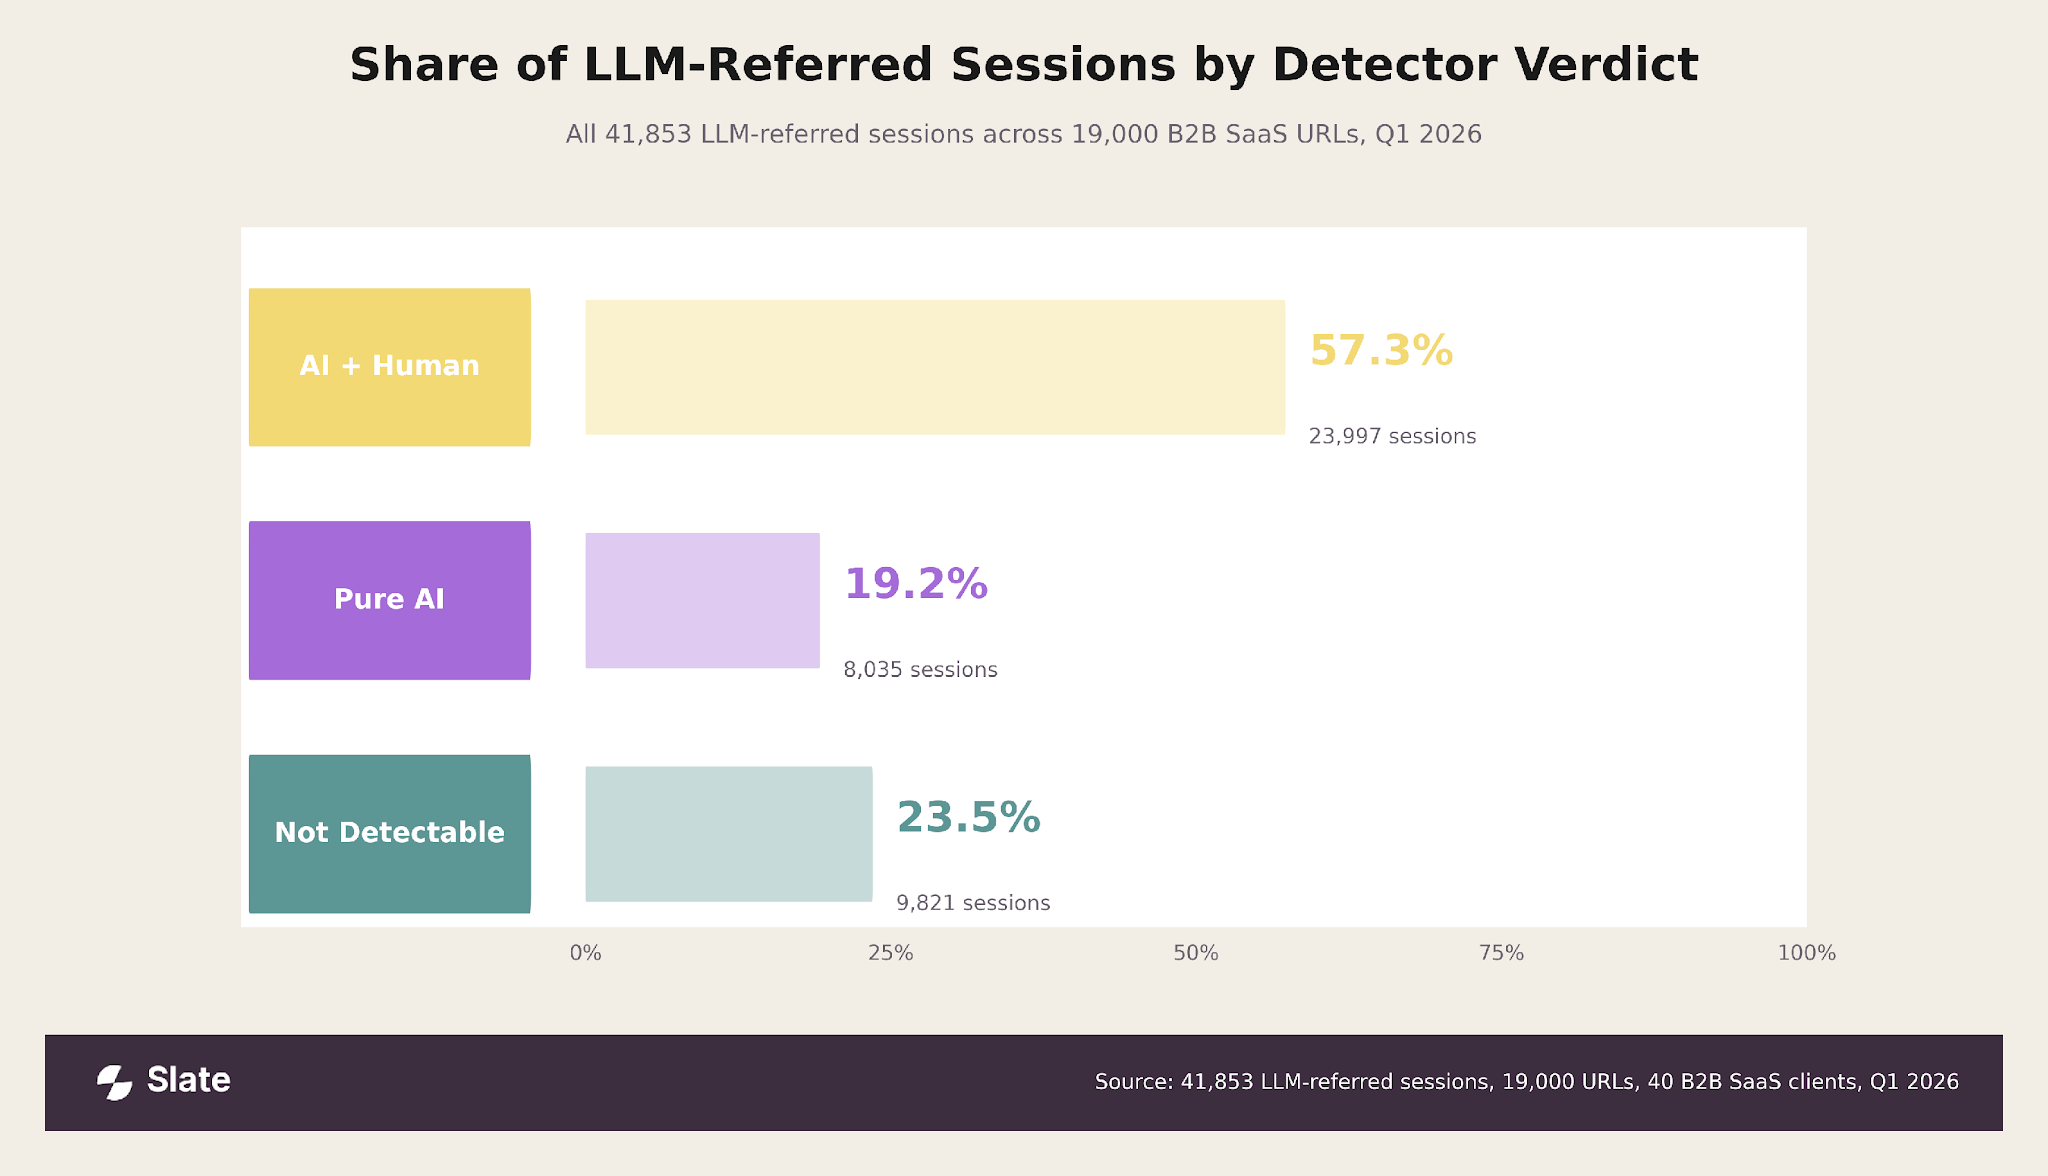
The first cut came back exactly the way the consensus said it would. Across 41,853 LLM-referred sessions in Q1 2026, 57% landed on AI+Human pages. 19% on Pure AI. The rest sat below the detector's confidence threshold.
Then someone caught the page-type column underneath the rollup, and the chart stopped making sense.
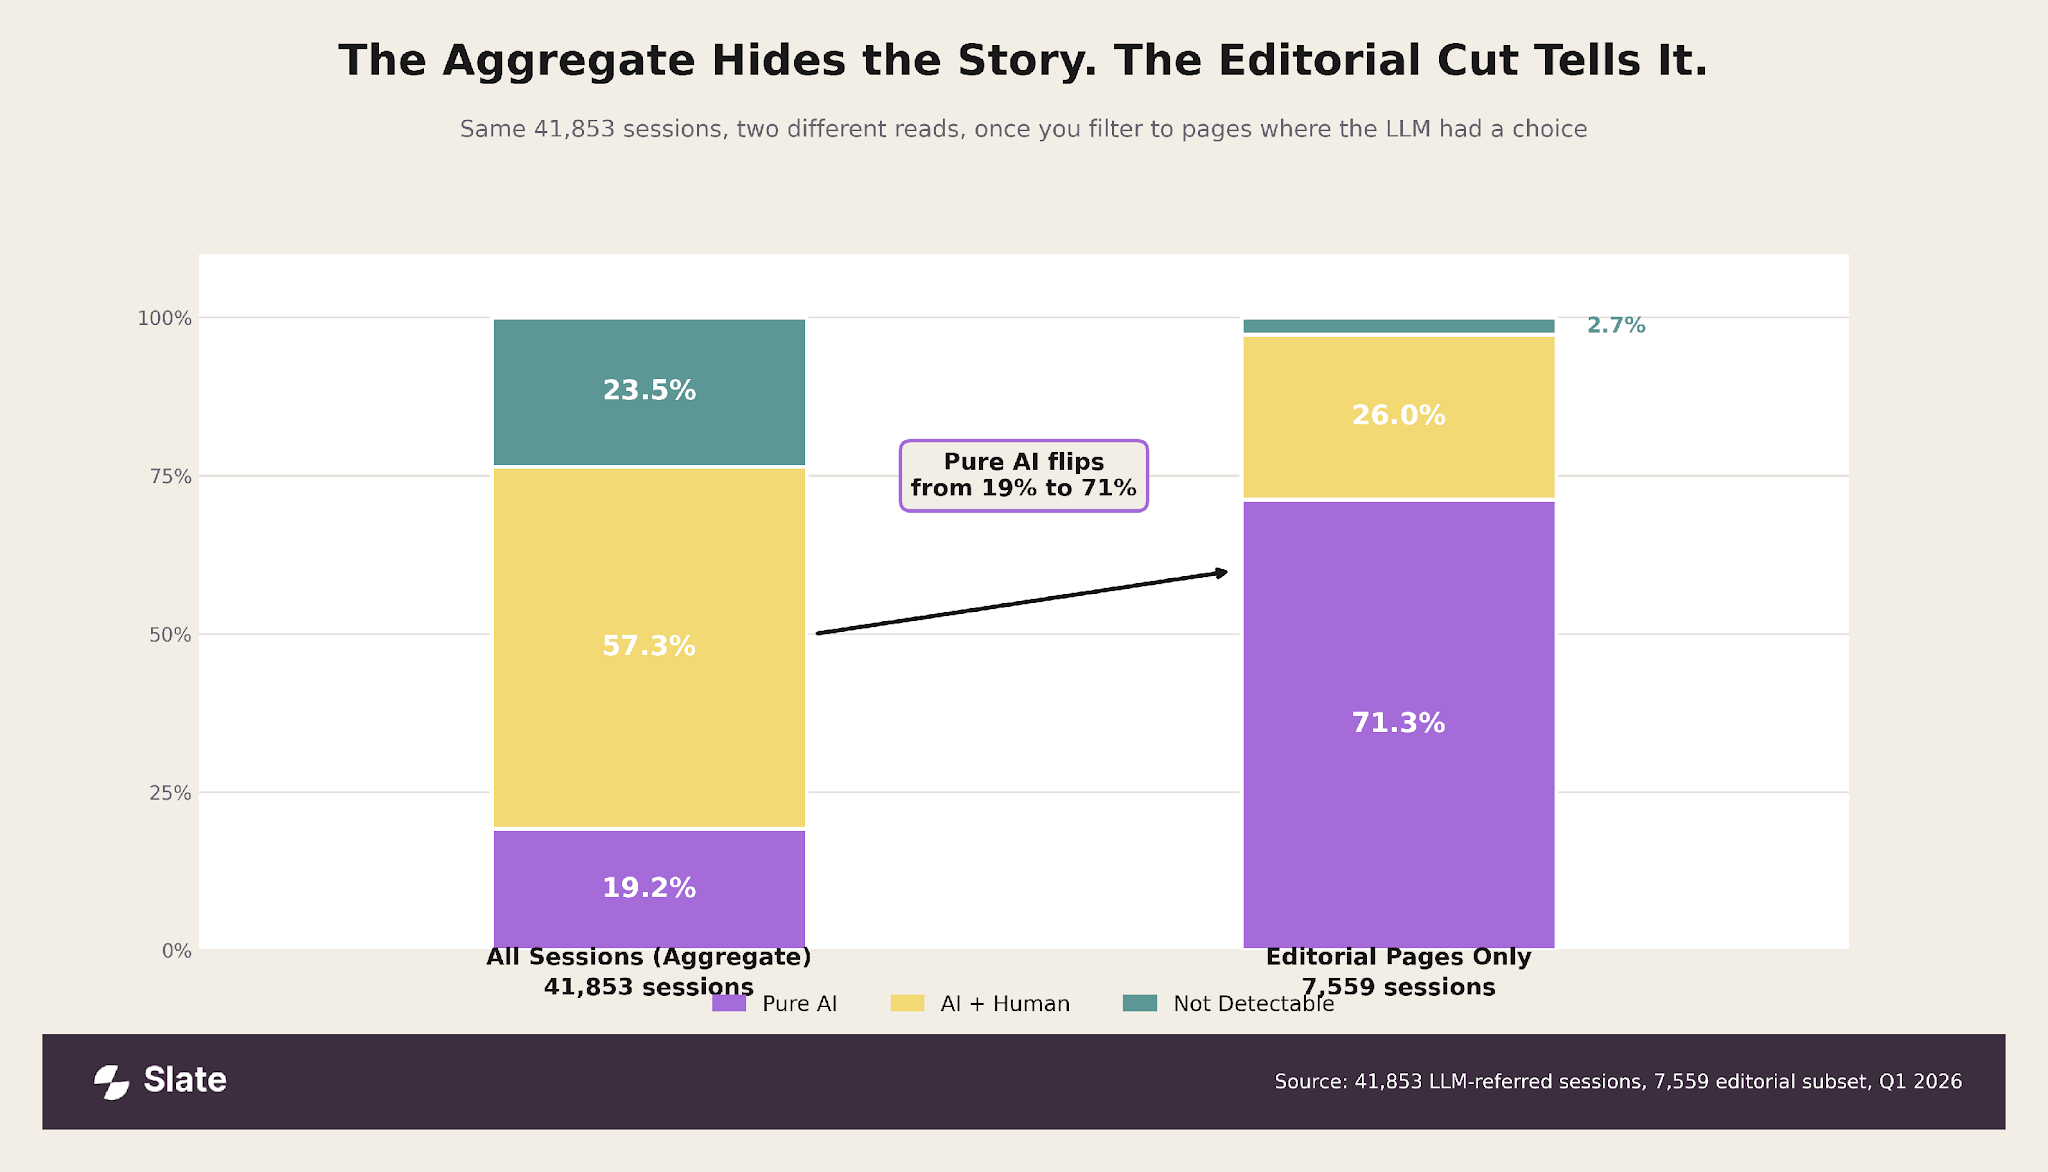
The first cut wasn't measuring "do LLMs reward editing." It was measuring "what kind of pages get LLM traffic in the first place." And almost every one of those pages turned out to be a homepage.
Filter to editorial pages, the cut where an LLM had a content pool to choose from. The same dataset reads 71% Pure AI, 26% AI+Human. Nearly the exact mirror image.
The rest of this piece is what that one filter tells us, and what to do about it.
What the Aggregate Was Really Measuring
The page-bucket breakdown makes the misread obvious.
Navigational sessions are 57.3% of total LLM traffic. Inside that bucket, Pure AI is a rounding error (1.1%) and AI+Human is 76.7%. That bucket alone is dragging the entire aggregate, and the bucket is made up of pages the LLM never had a real choice on.
Picture what's happening in those 23,997 navigational sessions. A buyer asks Claude "what should we use for X?" Claude gives a shortlist. The buyer opens that brand's homepage. The LLM did exactly one piece of work in that session, which was deciding the shortlist. Once the buyer clicks through, the homepage shows up whether its copy is AI-generated, human-written, or carved into stone.
Homepages also happen to be 76.7% AI+Human, because that's how homepages get made. Model draft, marketing pass, legal pass, launch. The 76.7% number is real and tells you something true about B2B SaaS homepage production. It tells you nothing about what LLMs reward.
The editorial row is the cut that answers the question we came in with. So that's where we went next.
What the Editorial Cut Looks Like Up Close
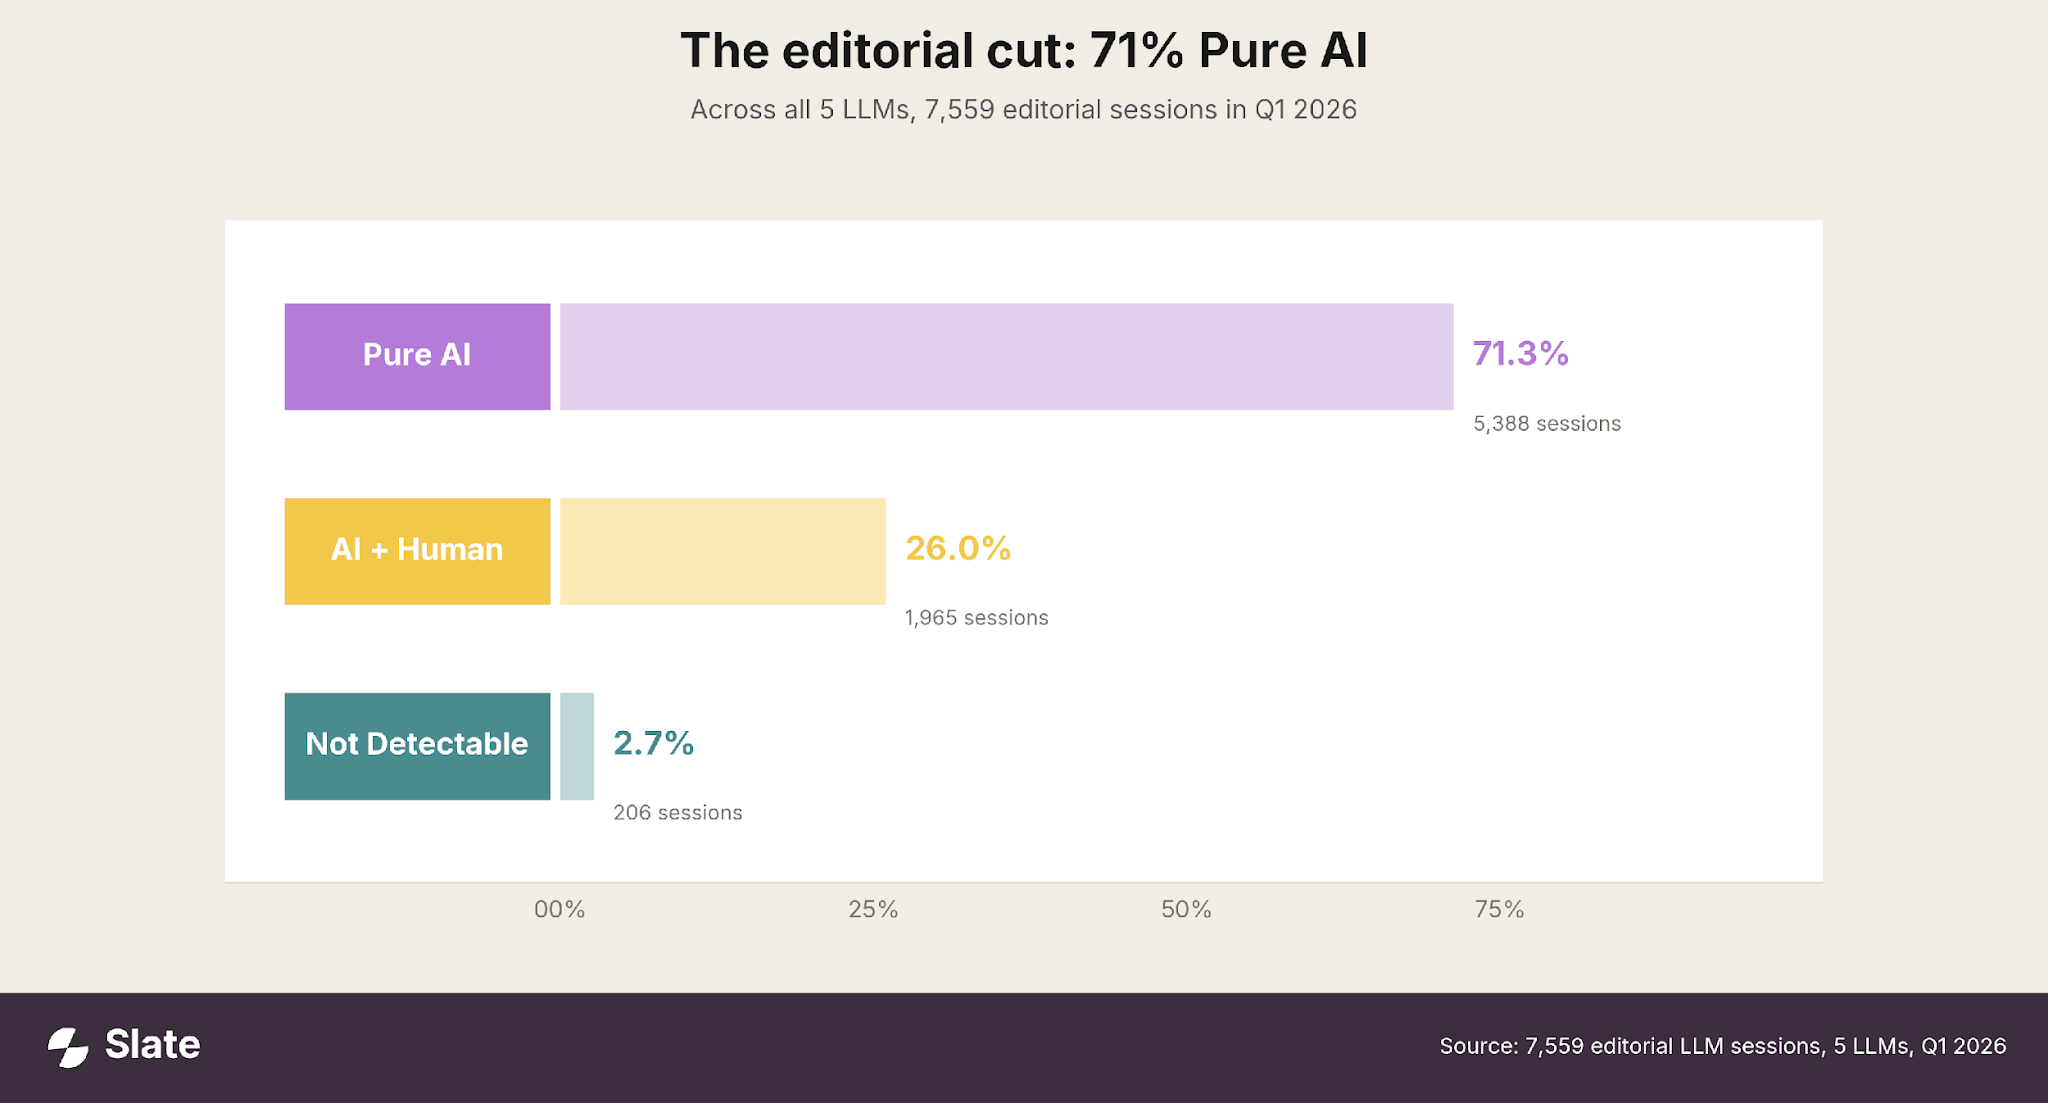
7,559 editorial sessions across the quarter. 5,388 to Pure AI pages. 1,965 to AI+Human. 206 below the detector's confidence threshold (thin content or 404s). Drop the unclassified row and the comparison is roughly 3 to 1 in favor of Pure AI.
We assumed the lopsidedness would be a quirk of a few formats. The hypothesis was that one or two sub-types were inflating the average and the rest would land closer to 50/50. That isn't what the breakdown showed.
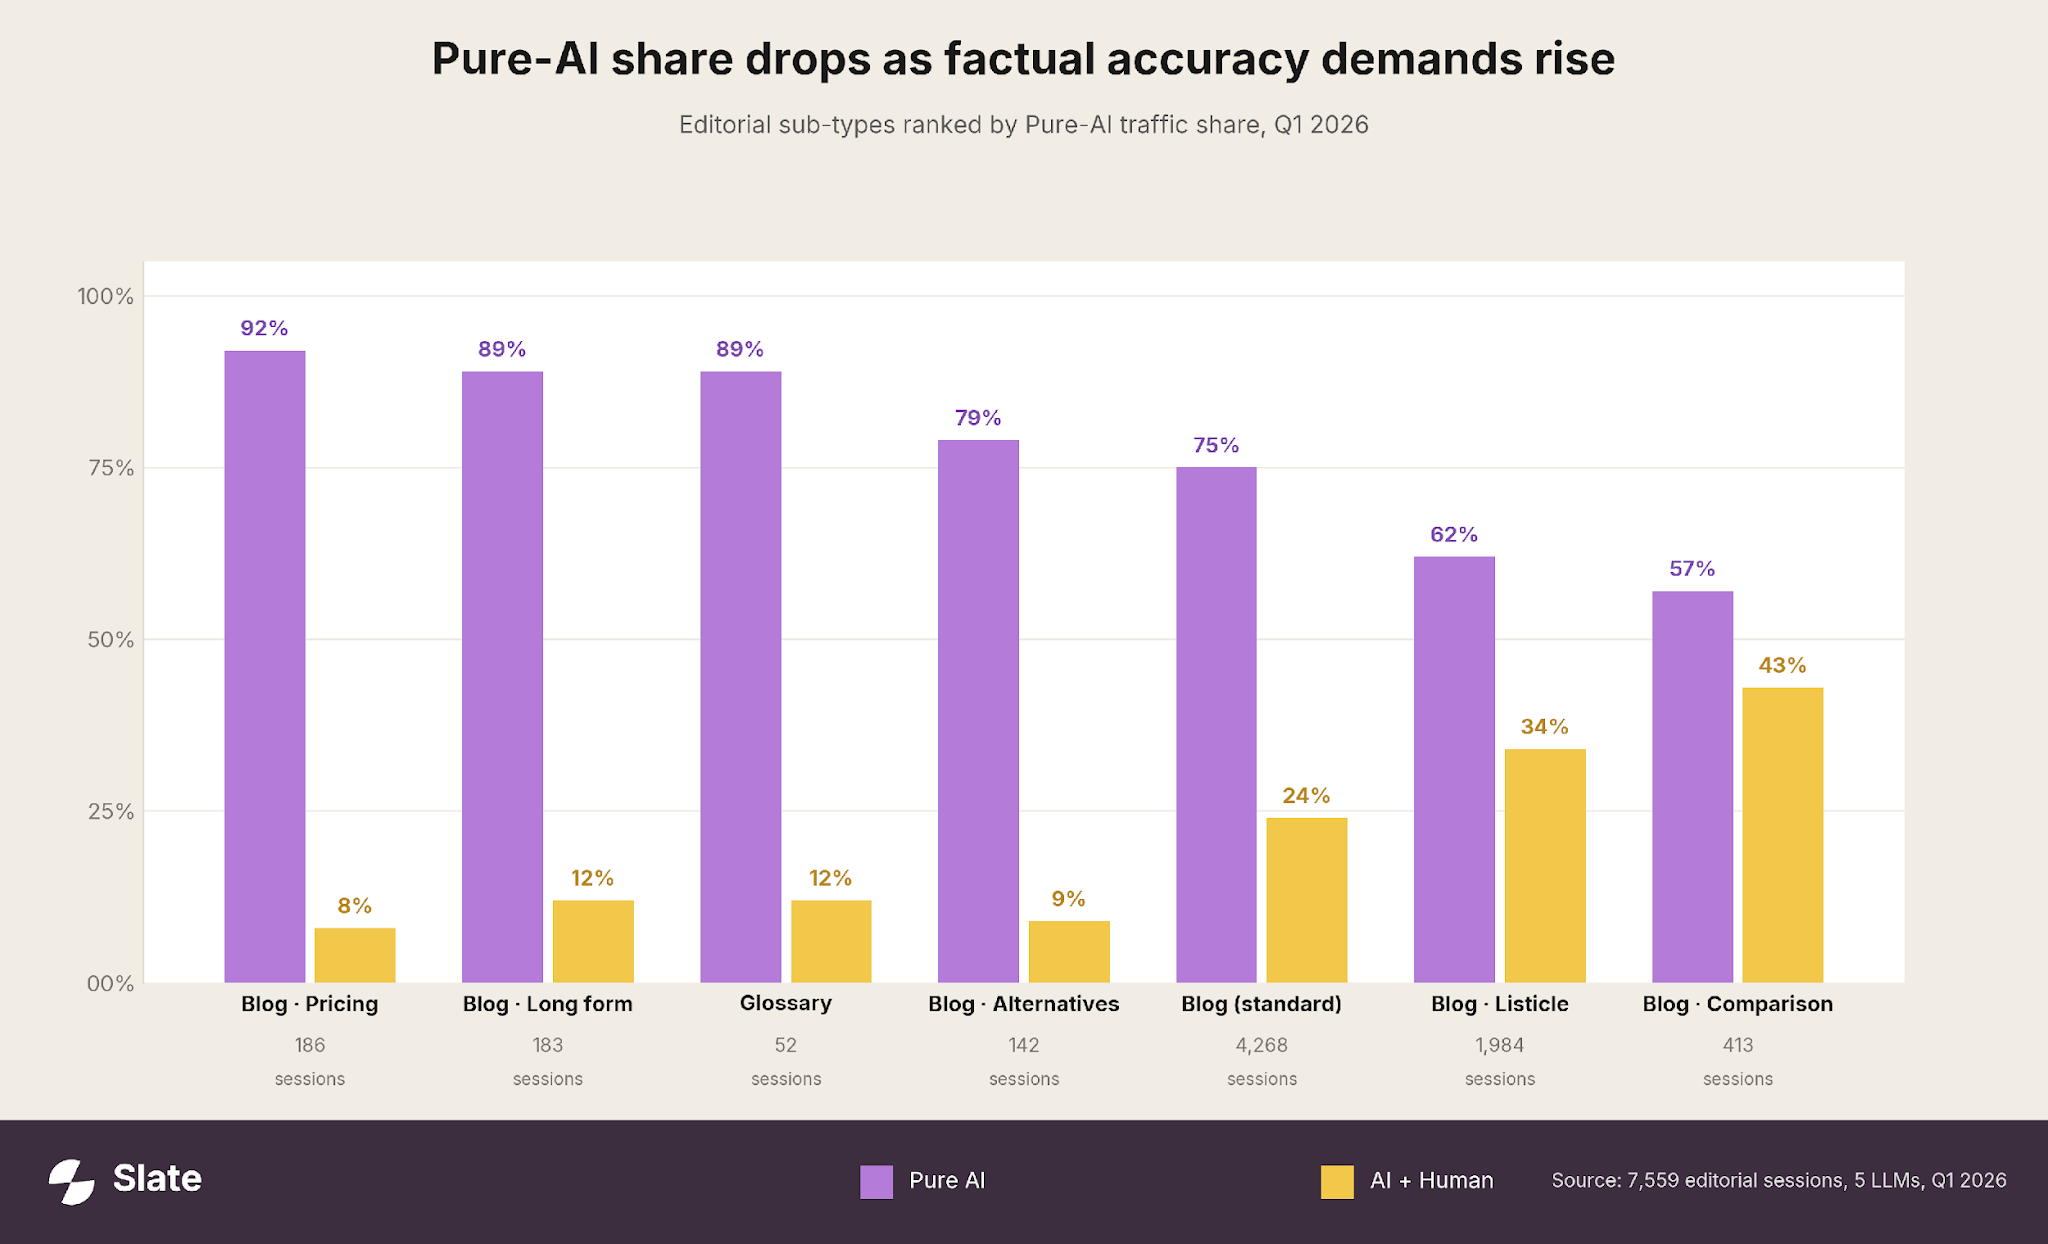
The same lopsided pattern holds in every sub-type except one.
Pricing posts come in at 92% Pure AI. Long-form guides and glossary entries both at 89%. Glossary is the cleanest example here. A 60-word definition is the exact shape of output a language model is trained to produce, and an LLM picking a citation reaches for the format that matches its own retrieval pattern.
Then the Pure-AI share drops in step with how much factual accuracy the format demands. Listicles slip to 62%. Comparison pages (the "X vs Y" format) land at 57%, the closest race anywhere in the data.
That last one is the exception worth its own section. It's where the editor pass is doing real work, even on the LLM citation layer.
Where Human Editing Still Pays Off
The 57/43 comparison split runs against a 75/25 average across the rest of editorial, and it tells you something specific about what an editor pass is buying.
A comparison post with one wrong pricing tier or one mislabeled integration loses the reader on the same page they landed on. LLMs trained on accuracy-weighted feedback learn to lean on pages where someone verified the spec table. That verification step is the human pass. Comparison content is the place an editor pays for themselves on citation share alone.
The commercial stakes are pulling in the same direction. Comparison queries sit closer to a purchase decision, which is why content teams already over-invest editor time on this format. The conversion math justifies it. The citation data confirms it.
There's a production-economics story underneath the 57/43 too. Comparison pages are 5.5% of editorial sessions (413 out of 7,559) against blogs at 56% (4,268). Low volume, high per-page edit time. That ratio is why teams can afford the editor on comparison even when they cannot on standard blog content.
The opposite is true at the top of the same table. Long-form and pricing posts cluster at 89% to 92% Pure AI because the volume justifies a leaner pipeline and the LLMs aren't penalizing the style. The format the LLMs reward most heavily for Pure AI is the format teams can most afford to ship Pure AI.
So far the picture is one Pure-AI number per format. The LLMs themselves are the next layer, and they don't all behave the same way.
The Per-LLM Picture
Across editorial content, the 5 LLMs span 44% to 74% Pure AI. Four of them sit between 61% and 74%, a tighter range than the consensus story would suggest. Most LLMs treat AI content roughly the same way, and the daylight is mostly inside one outlier.
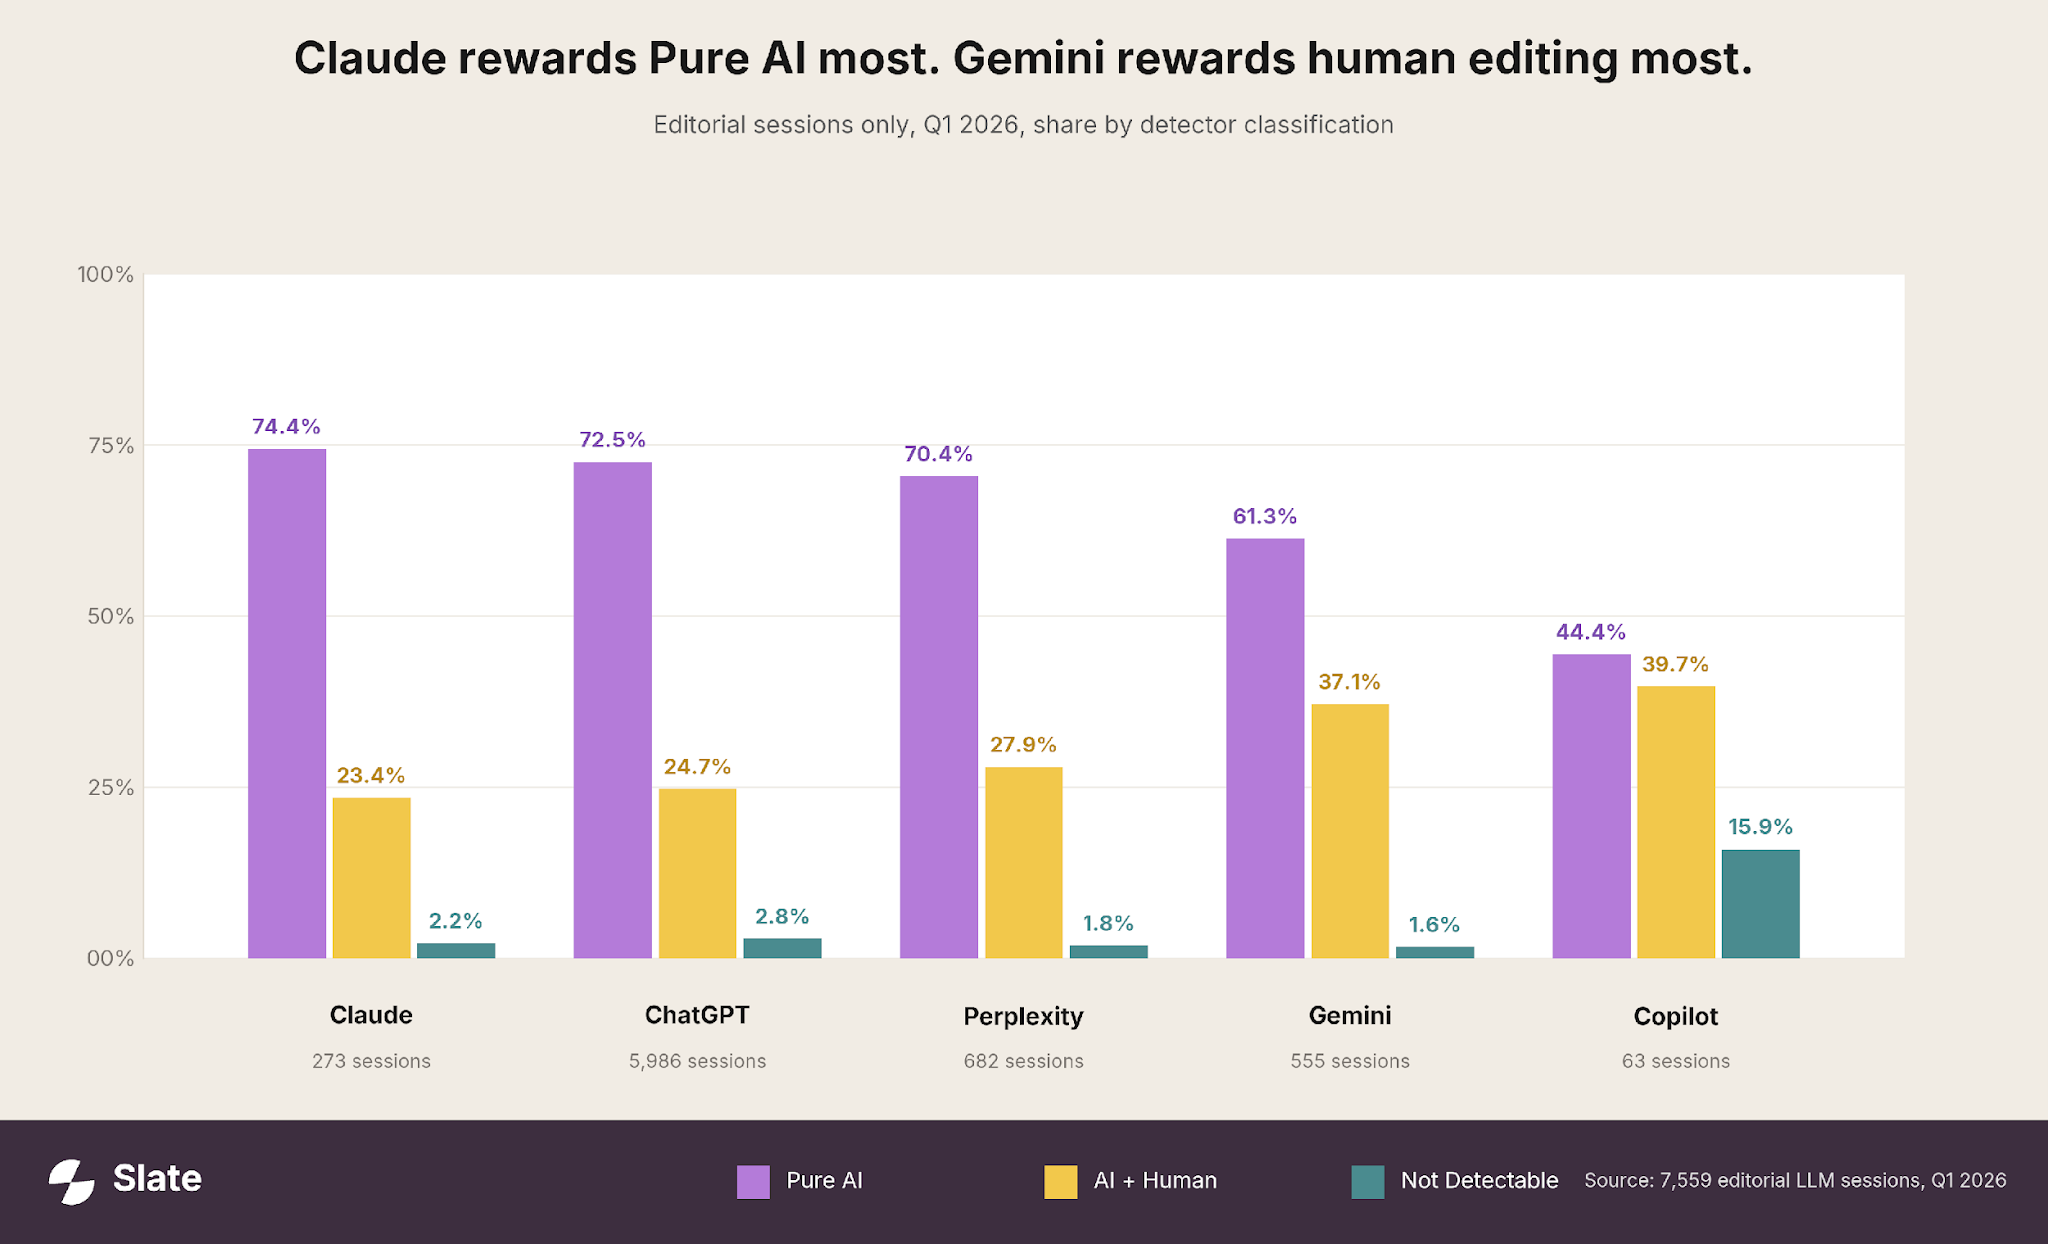
Claude is at the top of the range at 74.4%. ChatGPT and Perplexity come in close behind at 72.5% and 70.4%. ChatGPT is the volume channel inside that group by a wide margin (32,644 sessions, 78% of all LLM-referred traffic in the audit), so the 72.5% number is the one that moves the aggregate.
Gemini is the one that breaks the cluster. 61.3% Pure AI against everyone else around 70%. A 10-point gap inside the same dataset, in the same quarter, is the loudest LLM-specific signal we've got. Gemini is the LLM where AI+Human pages are over-indexed relative to peers, which lines up with what you'd expect from a model with a heavier retrieval-grounding pass on its citation flow.
Copilot's editorial sample is 63 sessions, which isn't enough to claim anything with confidence. Its 15.9% Not Detectable share also suggests its citation set leans on thin landing pages and 404s, so reading the Pure-AI number on its own is misleading.
The more useful per-LLM split is one level up: which pages each model sends traffic to in the first place. That's where the channels start to look different.
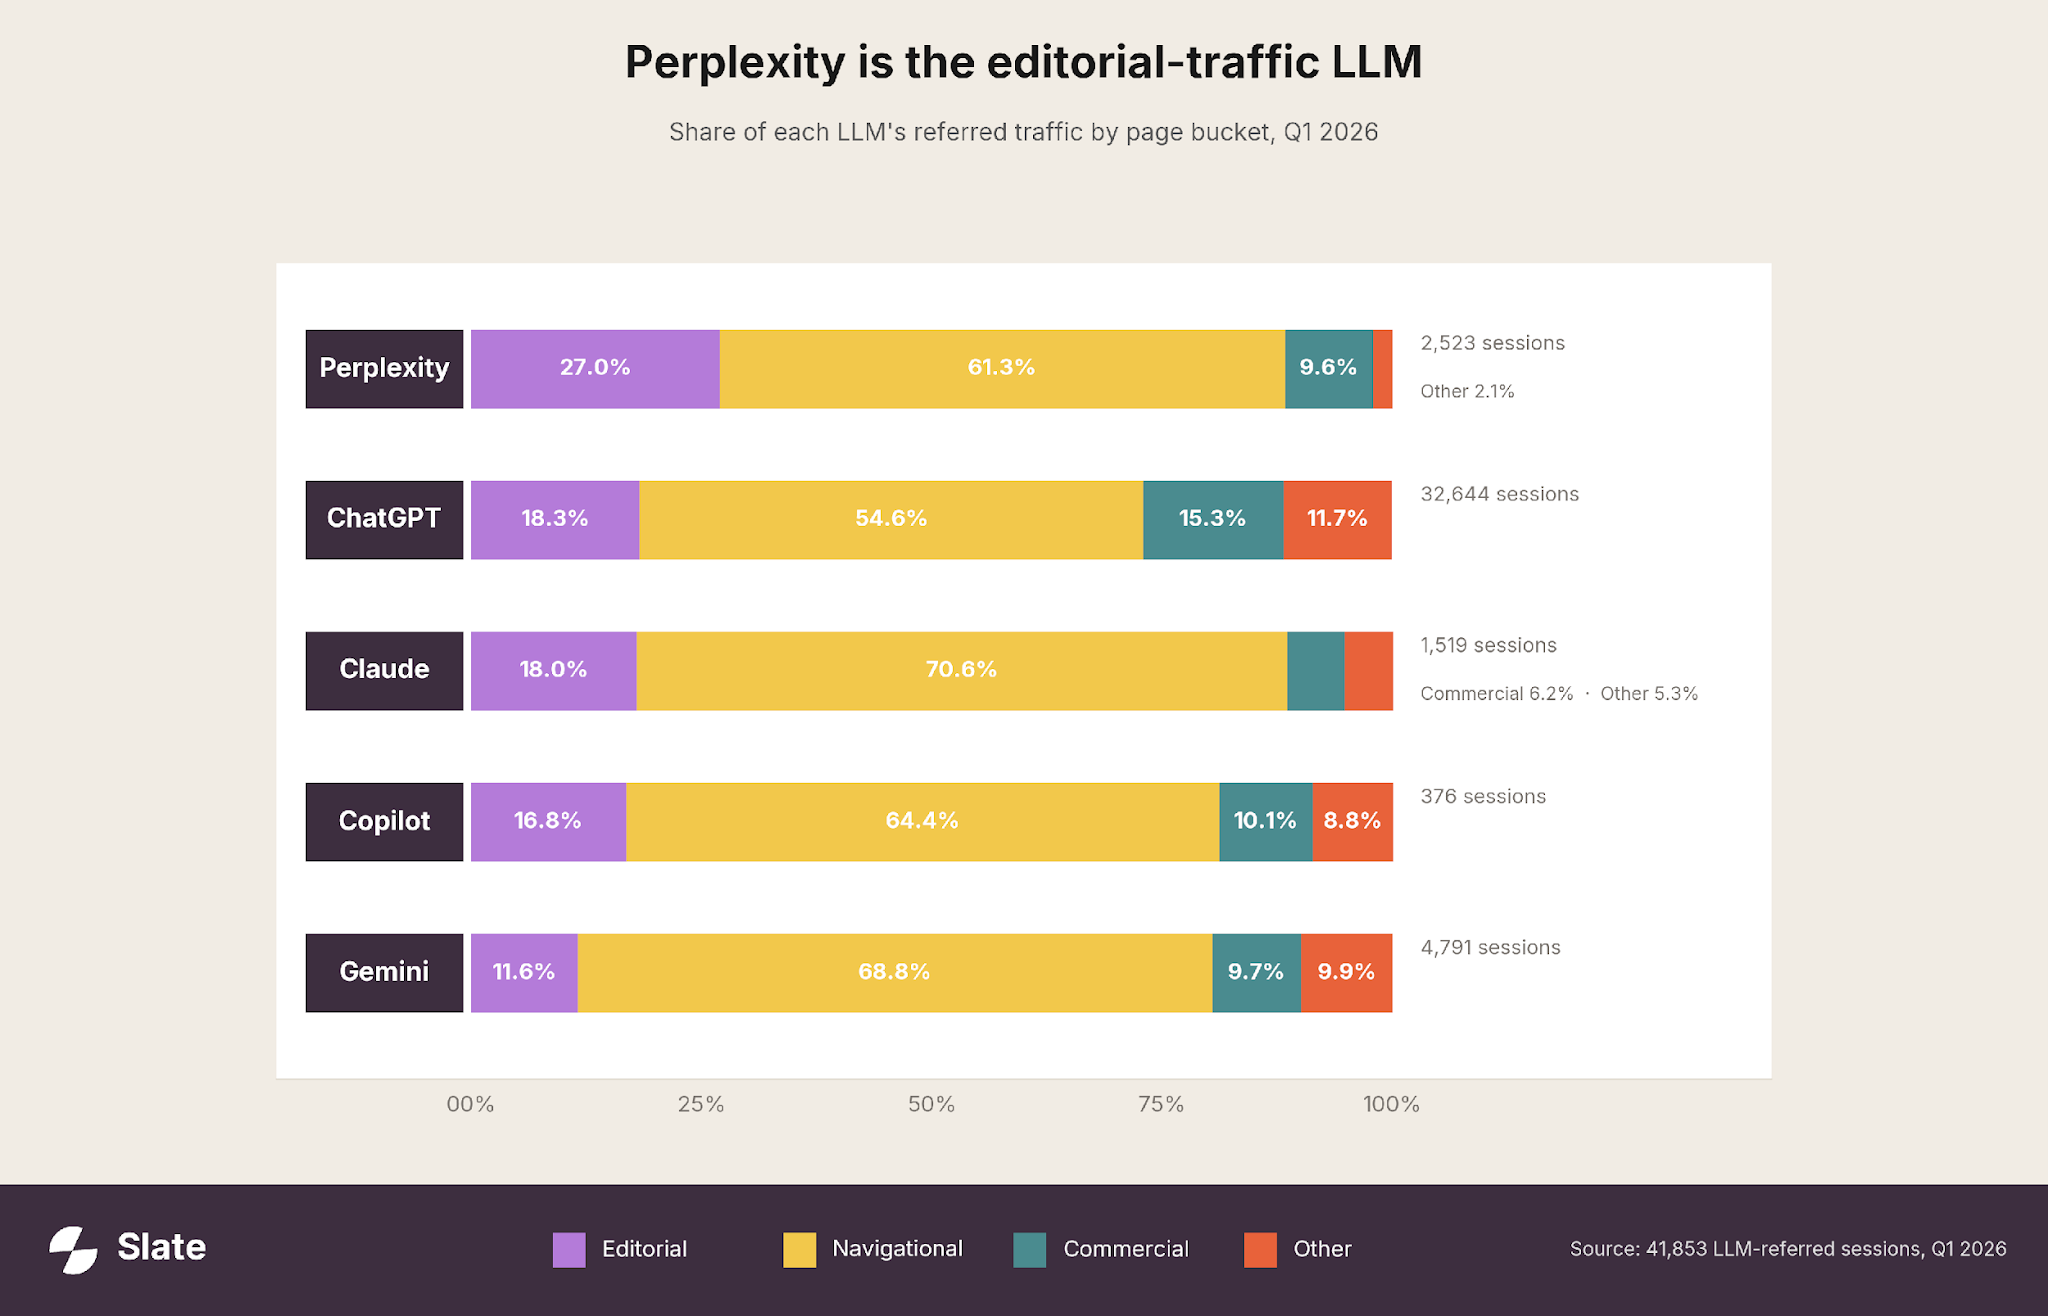
Perplexity sends 27% of its referred traffic to editorial pages. ChatGPT sends 18%. The other three sit below 18%, with Gemini and Claude pushing roughly two-thirds of their referred traffic to navigational pages instead.
So if your goal is LLM-referred traffic to your blog instead of your homepage, Perplexity is the highest-ratio channel by a long way. ChatGPT still wins on absolute volume because it's an order of magnitude bigger, but the Perplexity sessions are the ones landing where the editorial work happens.
Which finally gets us to what content teams should do with this.
What Changes for Content Teams
Three things follow from the data. None of them are surprising in isolation; what's surprising is how many teams are doing the opposite of all three.
The first is that Pure-AI editorial content is the dominant pattern in the LLM-citation data. 71% of editorial LLM sessions across all 5 major LLMs in Q1 2026 landed on Pure AI pages. Teams that held back on AI-led publishing because the LLMs would punish them are operating on a model the data does not support.
The Pure-AI Caveat That Matters
The detector reads writing style. It says nothing about the production process behind the page. Every Pure-AI page in this dataset that's pulling real LLM citations is sitting on top of a working pipeline:
• Brand guidelines the model gets prompted with
• A source URL set it's grounded on
• Internal data the model can cite
• A publishing pass that QAs the output before launch
Feed a model 5 reference URLs, publish whatever comes back, and you've got nothing. The bottleneck on LLM citation rate moved from "did a human write every sentence" to "is there a system that produces useful content at scale."
Most of the teams holding back on AI publishing weren't being held back by the LLMs. They were being held back by not having the pipeline.
The second is that comparison and pricing pages still need the editor. This is the one format where AI+Human is at parity, at 57/43, and it's also the format with the highest commercial intent. The editor pass on comparison is buying you both conversion and citation share at the same time. Cutting it to save production hours is the most expensive cut a content team can make this year.
The third is that per-LLM tracking is the only kind that gives you signal. Gemini rewards a human edit pass 10 points more than Claude does. Perplexity sends roughly 3x the editorial share Gemini does. The aggregate "LLM traffic" line in your dashboard is averaging across channels that behave nothing alike.
Build a Content System per Editorial Type
The headline finding ("Pure-AI editorial works") buries the harder question. What does the pipeline look like once you put it together.
The answer that holds across this dataset is that you need a dedicated content system for every editorial type you publish at scale. The formats covered in this audit are:
• Listicles
• Comparison pages
• Glossary entries
• Long-form guides
• Pricing posts
• Standard blogs
Each one pulls from a different source shape, scores differently in the citation data, and breaks under different prompts. One generic "AI content workflow" produces the failure case in the lede. Teams that publish at the 89% to 92% Pure-AI rates from the top of the sub-type chart got there by treating each format as its own system.
Each system has the same three layers:
• A grounded prompt set. Source URLs, brand guidelines, internal data, and the structural rubric for that format. A comparison system grounds on the spec sheets of both products. A glossary system grounds on the canonical definition plus 3 to 5 examples. The grounding is what makes the output citation-grade.
• A polishing loop. The model output rarely ships clean on the first prompt. The system needs a model-side polish pass (style alignment, tone correction, format-specific edits) before any human ever sees the draft. Skipping this step is what produces the unusable first-quarter output most teams remember and then quote when they tell you AI content doesn't work.
• A real editor reviewing the output. Not a generic content editor. An editor with full product understanding, who knows what the spec table should say and which framing the brand owns. The editor sits alongside the system and reviews quality every cycle until the system reaches a steady state. Once it does, the editor time per page collapses to QA on a known-good pipeline.
The catch is that none of those three layers harvest immediately. The system takes effort to build and weeks of editor-loop iteration before the content production fruit starts coming. Most teams quit between week two and week six, which is the exact window the system is being shaped to scale at all.
Comparison and pricing are the formats where this discipline is most expensive to skip. Glossary and long-form are the formats where the same discipline gets you to 89% to 92% Pure-AI citation share and a leaner production cost. The categories above are the same chart in two different lights.
There's one reframe worth setting before any of this gets operationalized. "Is your content AI or human" doesn't really map onto anything you can measure anymore. Virtually no B2B SaaS content in 2026 is one or the other. The real question is whether your system for the format you're publishing is producing useful, citation-grade output every week, or whether it's producing noise.
Methodology
Source data: GA4 session data from B2B SaaS client properties under TripleDart's management. We pulled every URL that drove at least one LLM-referred session during Q1 2026 (Jan 1 to Mar 31, 2026). We anonymized account-level identifiers and rolled findings up to the portfolio.
LLM source identification used GA4 source/medium tagging against the known referrers: chatgpt.com and chat.openai.com (ChatGPT), claude.ai (Claude), perplexity.ai (Perplexity), gemini.google.com (Gemini), copilot.microsoft.com (Copilot).
AI detection: every URL ran through a TripleDart-built bulk detector built on the DeBERTa-v3-large model, deployed via Hugging Face Spaces. Three buckets: Pure AI (high-confidence AI-generated body content), AI + Human (model draft with detectable human revision), Not Detectable (insufficient body content for a confident classification).
The detector needs roughly 300 words of body content to score confidently. Pages with less, plus 404s, fall into Not Detectable by design. Three-class agreement against an internal calibration set was 87%.
Page-type tagging: each URL got one of 30+ page types and was grouped into four analytical buckets: Navigational, Editorial, Commercial, Other.
The whole pipeline runs through Slate: URL classification, detector scoring, GA4 join, per-LLM and per-bucket breakdowns. Running 19,000 URLs through this manually would have eaten a quarter for a small team.
The scope is calibrated to B2B SaaS, agency-managed properties, mostly DR 40+. E-commerce, consumer media, and local-services content have different LLM citation patterns. The methodology transfers cleanly; the absolute numbers may not.
Running the same audit on your portfolio is a 4-cut exercise. Pull per-LLM citation share. Pull per-bucket share. Pull per-format Pure-AI / AI+Human split. And map where your editor time is currently sitting against the formats that earn it.
When you're ready to see this audit run on your portfolio, book a Slate demo and we'll plug your GA4 data in.