If your Q1 numbers came in lower than the forecast, you're in good company.
Most tech traffic forecasts have been drifting from reality since late 2024. Pages rank where they're supposed to. The planning sheet says they should ship X clicks. Search Console says it's more like X ÷ 10.
The pattern shows up across verticals, customer cohorts, and content formats. Every quarter, somebody has to walk the leadership team through it.
The content usually isn't always the problem; the forecast formula can also be.
The standard SEO forecast multiplies keyword search volume by a CTR-by-position curve, both pulled from third-party tools. Both inputs were calibrated for a SERP that no longer exists.
AI Overviews now sit between the user and your URL on most informational queries. Google Ads units own more above-the-fold real estate than they did two years ago. Search Console reports impressions on plenty of queries the user never visually reached.
So we ran the numbers.
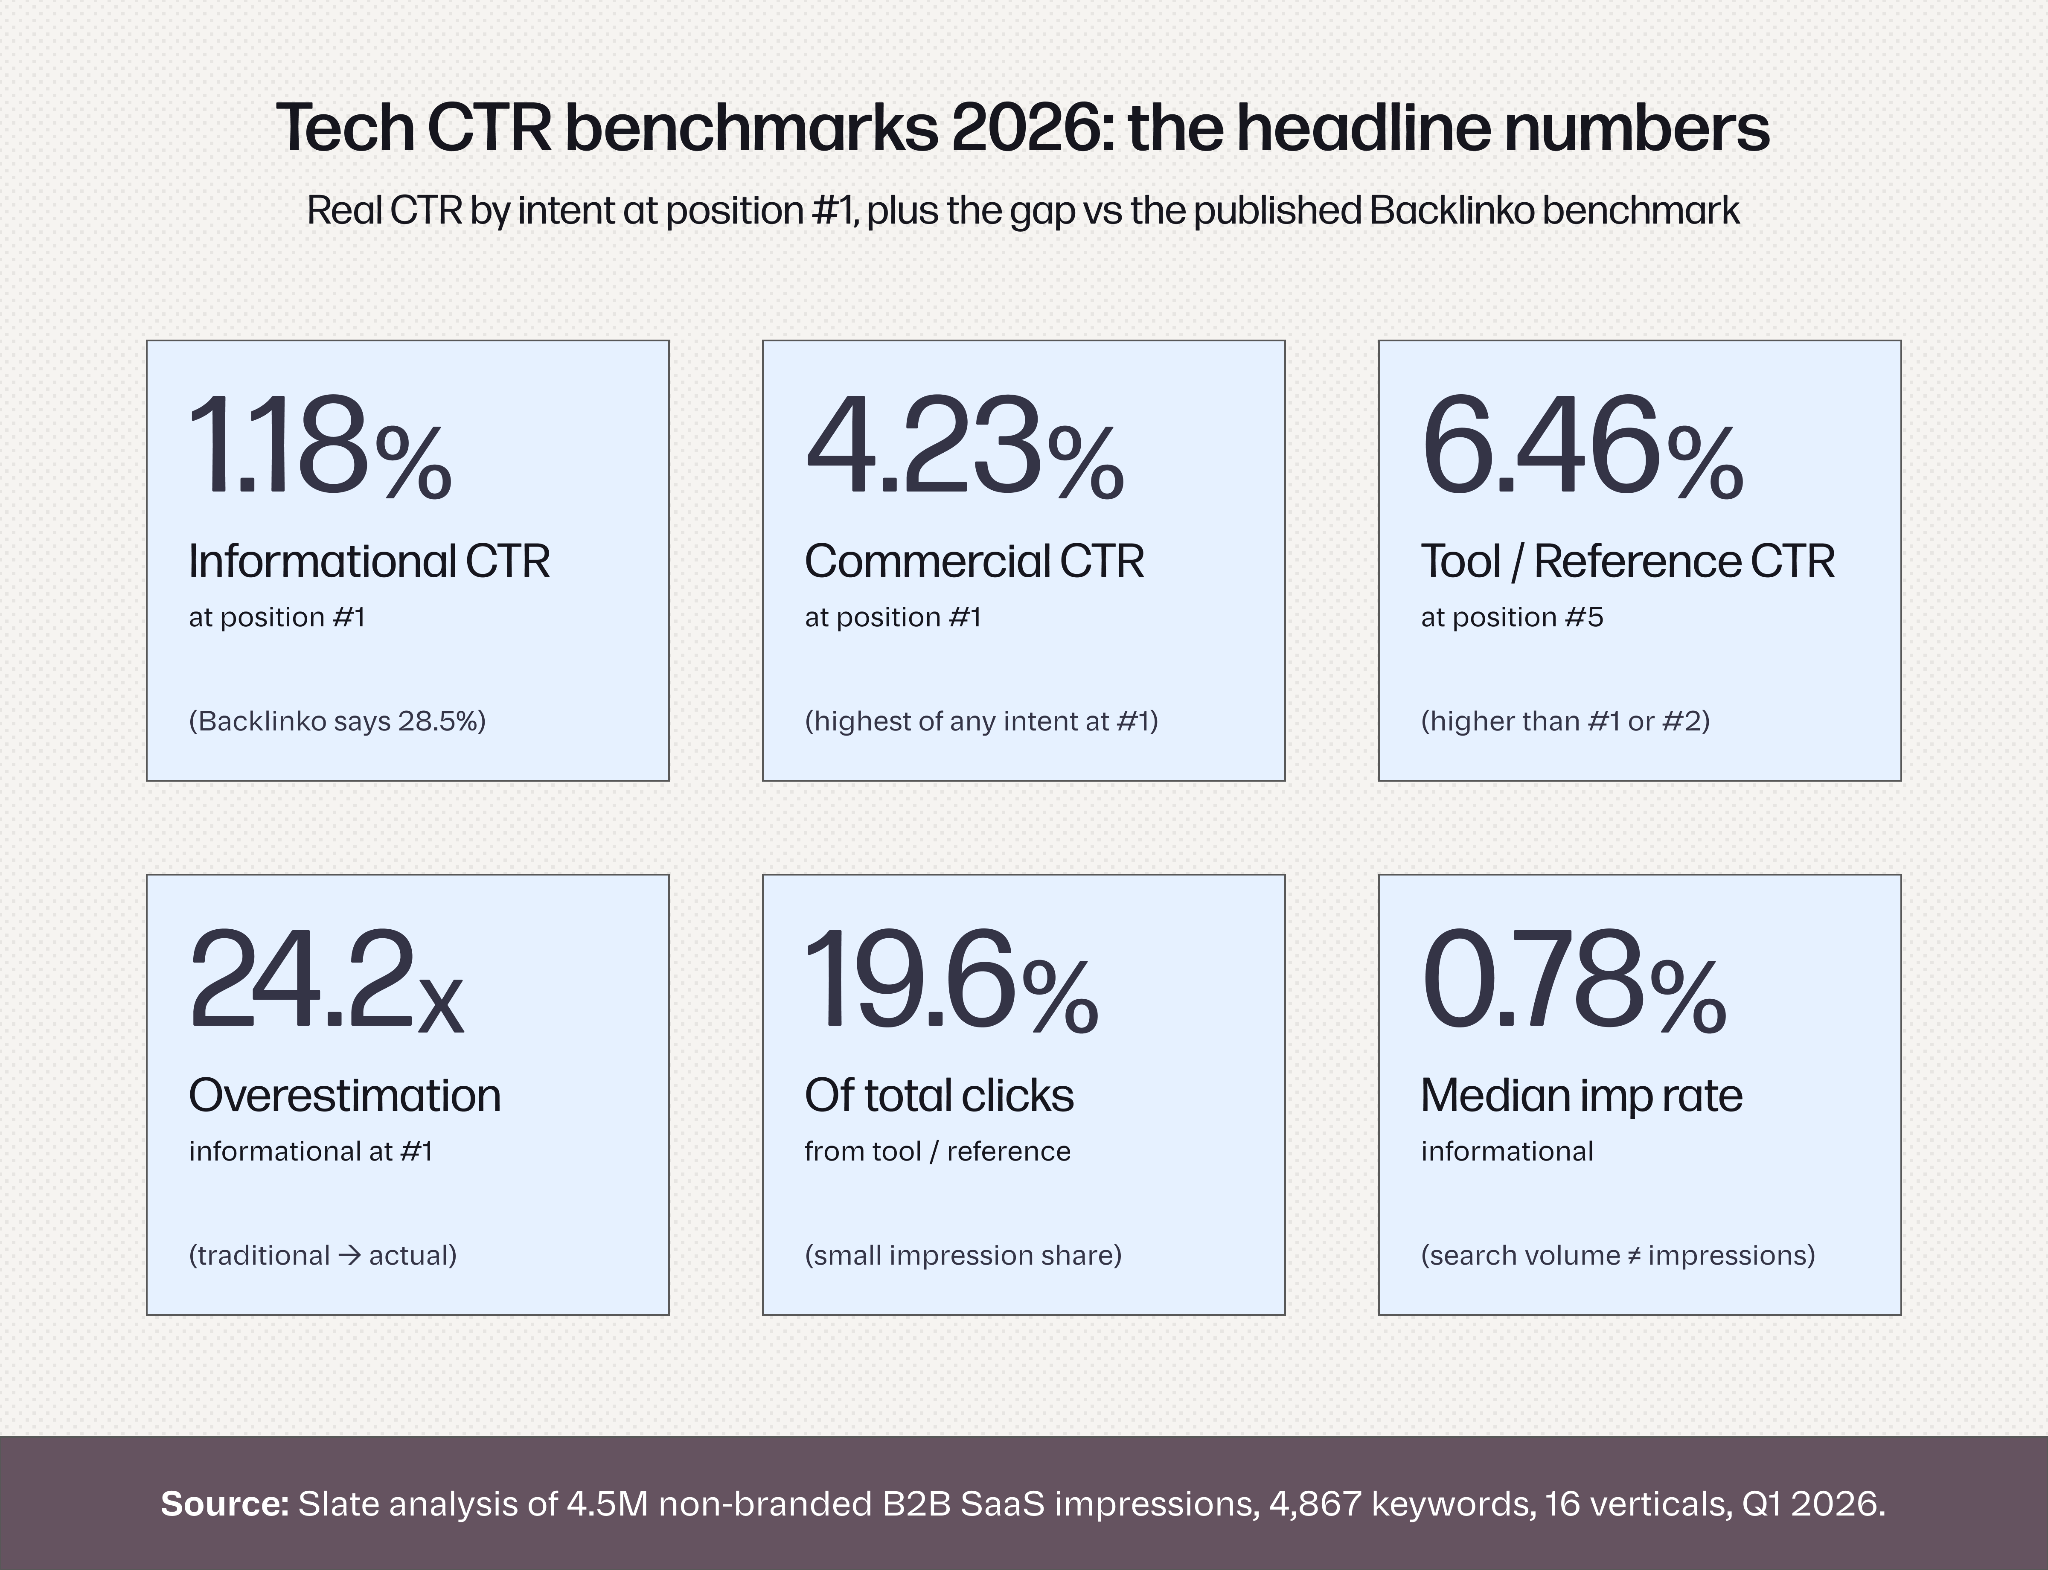
This study covers non-branded keywords across 16 B2B tech verticals, 4.5M impressions, and Q1 2026 data, all from Google Search Console. We classified every keyword by intent type, computed weighted CTR at every position, and compared what we measured against what the public benchmarks would have predicted.
The headline finding:
Published CTR benchmarks on the internet overstate non-branded clicks by 5x to 24x depending on intent and position. The miss is consistent (and huge) enough that we could rebuild the forecast formula around it.
The new version that we’ll share has three inputs instead of two, with every assumption traceable to first-party GSC data instead of third-party defaults.
What follows: the new tech CTR benchmark, why intent has become more useful than position, and the rebuilt forecast model you can drop into your planning sheet.
Key Findings
- Position #1 ships 1.80% weighted CTR for non-branded, against a 27.6% to 28.5% traditional benchmark. Inside that average: 1.18% for informational, 4.23% for commercial, 2.83% for tool / reference.
- Intent predicts CTR better than position. A keyword at position #5 can ship anywhere from 0.48% to 6.46% CTR. Same rank, 13x difference, depending on what the user wants.
- Tool and reference holds. It captures 19.6% of all clicks from a small share of impressions. Positions #3 to #5 ship higher CTR than #1 and #2 because category incumbents own the top of the SERP.
- Search volume isn't impressions. Median impression rate runs 0.62x to 1.79x depending on intent. Plug Ahrefs volume directly into a forecast and the impression number is already off before CTR multiplies in.
- Three inputs, not two. The new formula uses Search Volume × Impression Rate by Intent × CTR by Intent and Position.
- Informational needs new metrics. Traffic value has migrated from Google clicks to LLM citations. Click volume alone no longer reflects what the content is doing.
What's the Average CTR at Position #1 for Tech Brands Right Now?
For non-branded tech keywords, the weighted average CTR at position #1 is 1.80% across our dataset. Note that 99% of navigational queries are branded (ex., “Nike official website”) - so we don’t count them here.
Inside that average, the curve splits sharply by intent:
- Informational queries: 1.18%
- Commercial queries: 4.23%
- Tool / reference queries: 2.83%
The Backlinko CTR study reports 27.6% at position #1. First Page Sage reports 39.8%. Blend Backlinko with Semrush's State of Search numbers and the "traditional benchmark" cited in most tech planning decks settles around 28.5%.
That blended number is the comparison column we use in the table below.
Each of those numbers is correct in its original context. They include branded queries (where the user typed your name and clicked your URL by intent) and blend across every vertical.
Filter to non-branded only, and the curve compresses by 5x to 24x depending on intent.
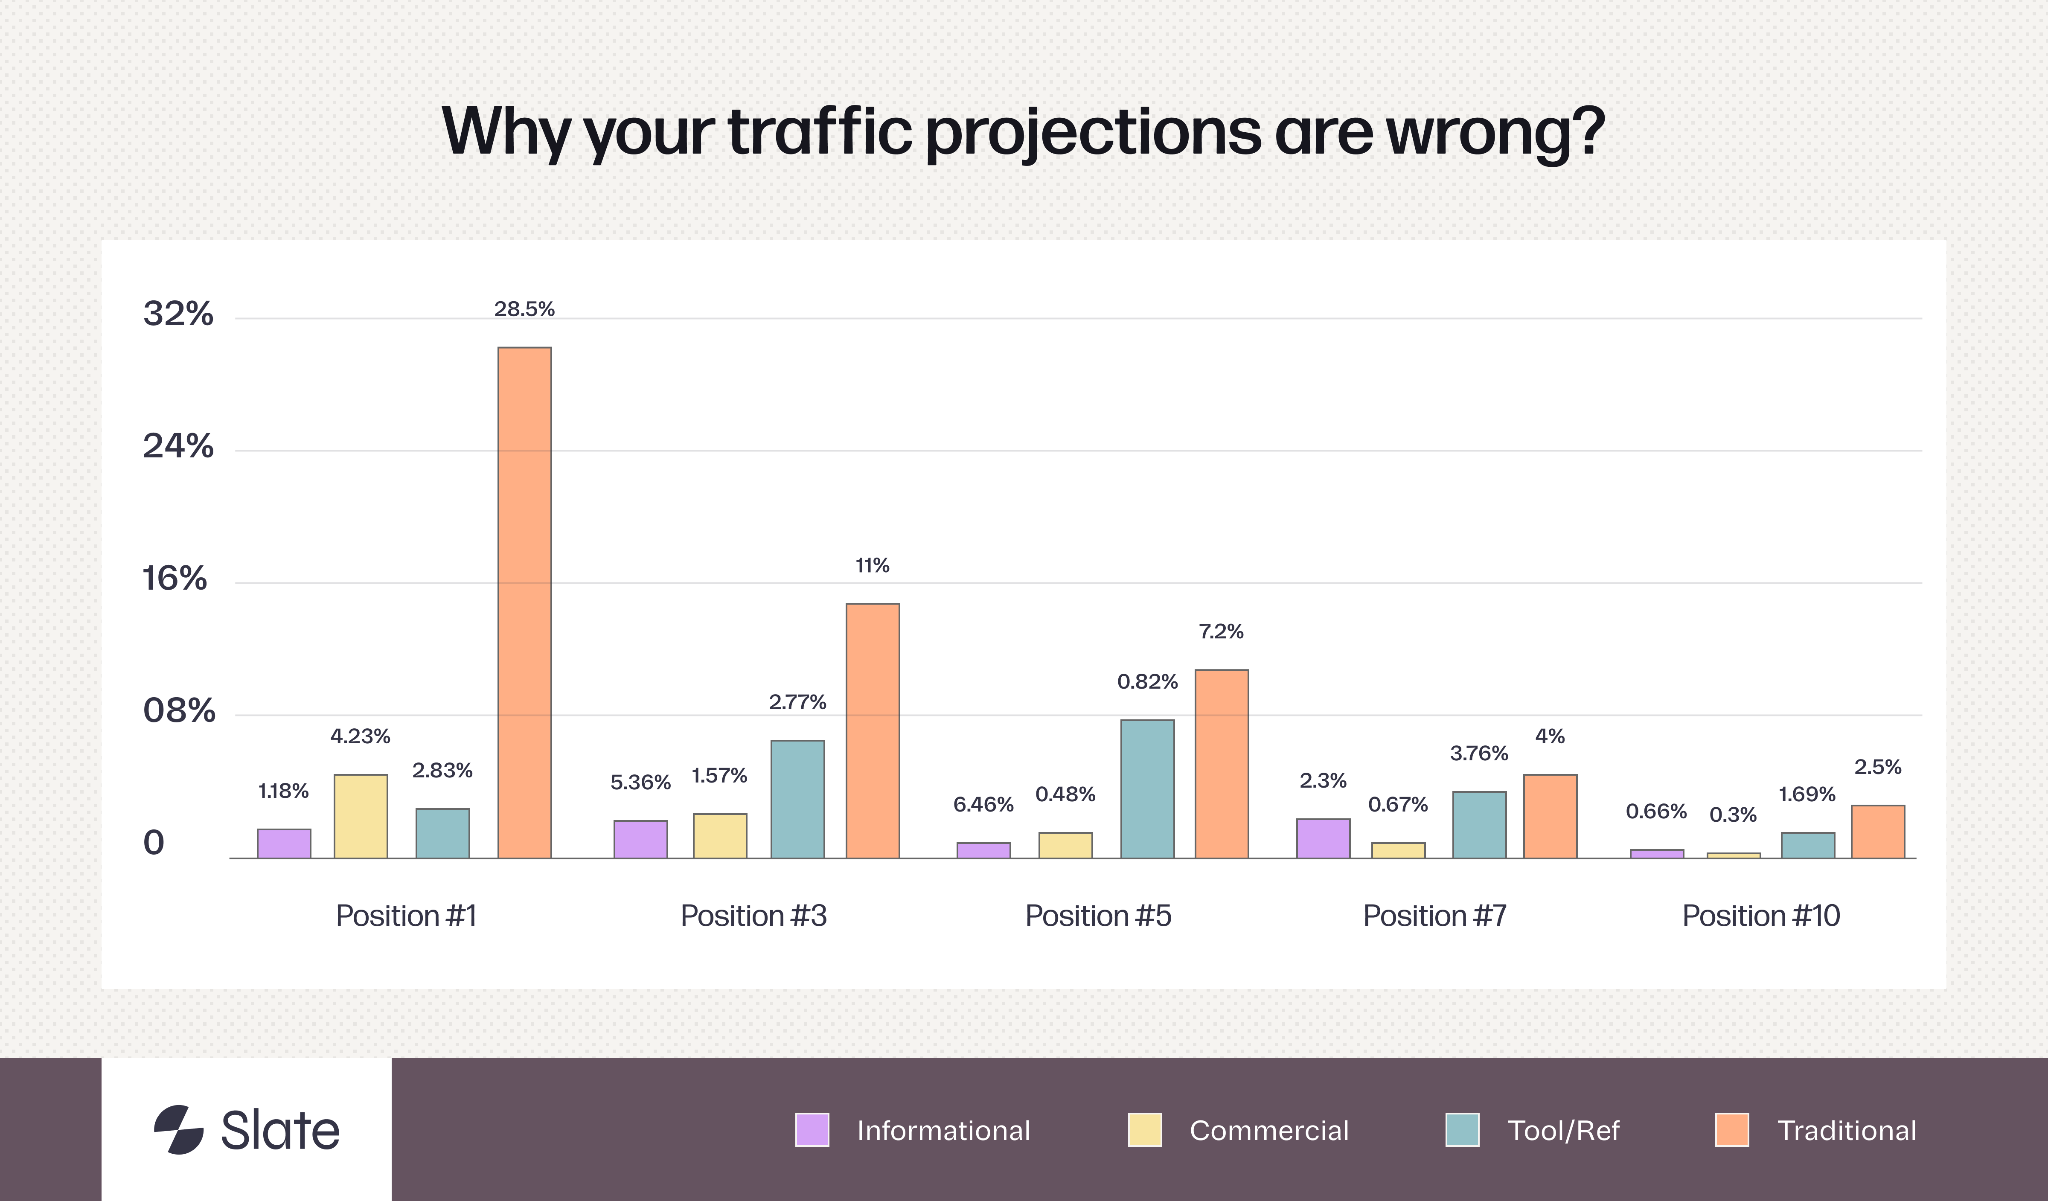
Why such a big spread between intents at the same rank?
Because what the user sees on the SERP is different now. (We unpacked the wider AI SEO playbook separately if you want the full picture.)
For an informational head term, the AI Overview answers the question right above the organic result. For a commercial comparison query, the user still scrolls and clicks. For a tool query, the user has to click to get the asset.
Three different user behaviors, three different CTR curves, all stacked together in the public benchmark.
We'll unpack each curve in a moment. First, the structural reason the forecast formula stopped working.
Why Your SEO Traffic Forecast Doesn't Match Reality
The standard SEO forecast looks like this:
Predicted Clicks = Search Volume × CTR by Position
Both inputs come from third-party tools. Both have drifted from what's happening on the live SERP. And neither captures the variable that turns out to explain most of the variance.
Here's how each one is broken (and what to use instead).
Search volume from Ahrefs, Semrush, or Google Keyword Planner is a ceiling, not a forecast input.
The number reports how often the query is searched globally or by country. It doesn't adjust for what reaches your URL above the fold once SERP features, AI Overviews, ad units, and local packs eat the screen. We measured this gap (more on that in a later section), and it varies by intent. If you're rethinking your tooling stack around all of this, our Semrush alternatives breakdown covers the AI-first replacements worth a look.
CTR by position from Backlinko is blended across all query types, including branded.
Branded navigational queries (where the user typed "salesforce login") inflate the curve because the user already decided to click before they hit the page. For non-branded, that blend produces a curve that overstates clicks by 5x to 24x.
The third input nobody adds is intent type.
A "what is X" head term, an "X vs Y" comparison query, and an "X template" tool query each behave differently on the same SERP. Lumping them under one CTR curve produces a number with no predictive value.
We saw this pattern across our customer base in 2025. A glossary cluster forecast at 12,000 monthly clicks delivered 600. A how-to library forecast at 40,000 clicks delivered 2,300. A pricing page forecast at 1,200 clicks delivered 480.
The pages were ranking. The forecasts had drifted because every input in the formula had drifted, and nobody had stopped to redo the math.
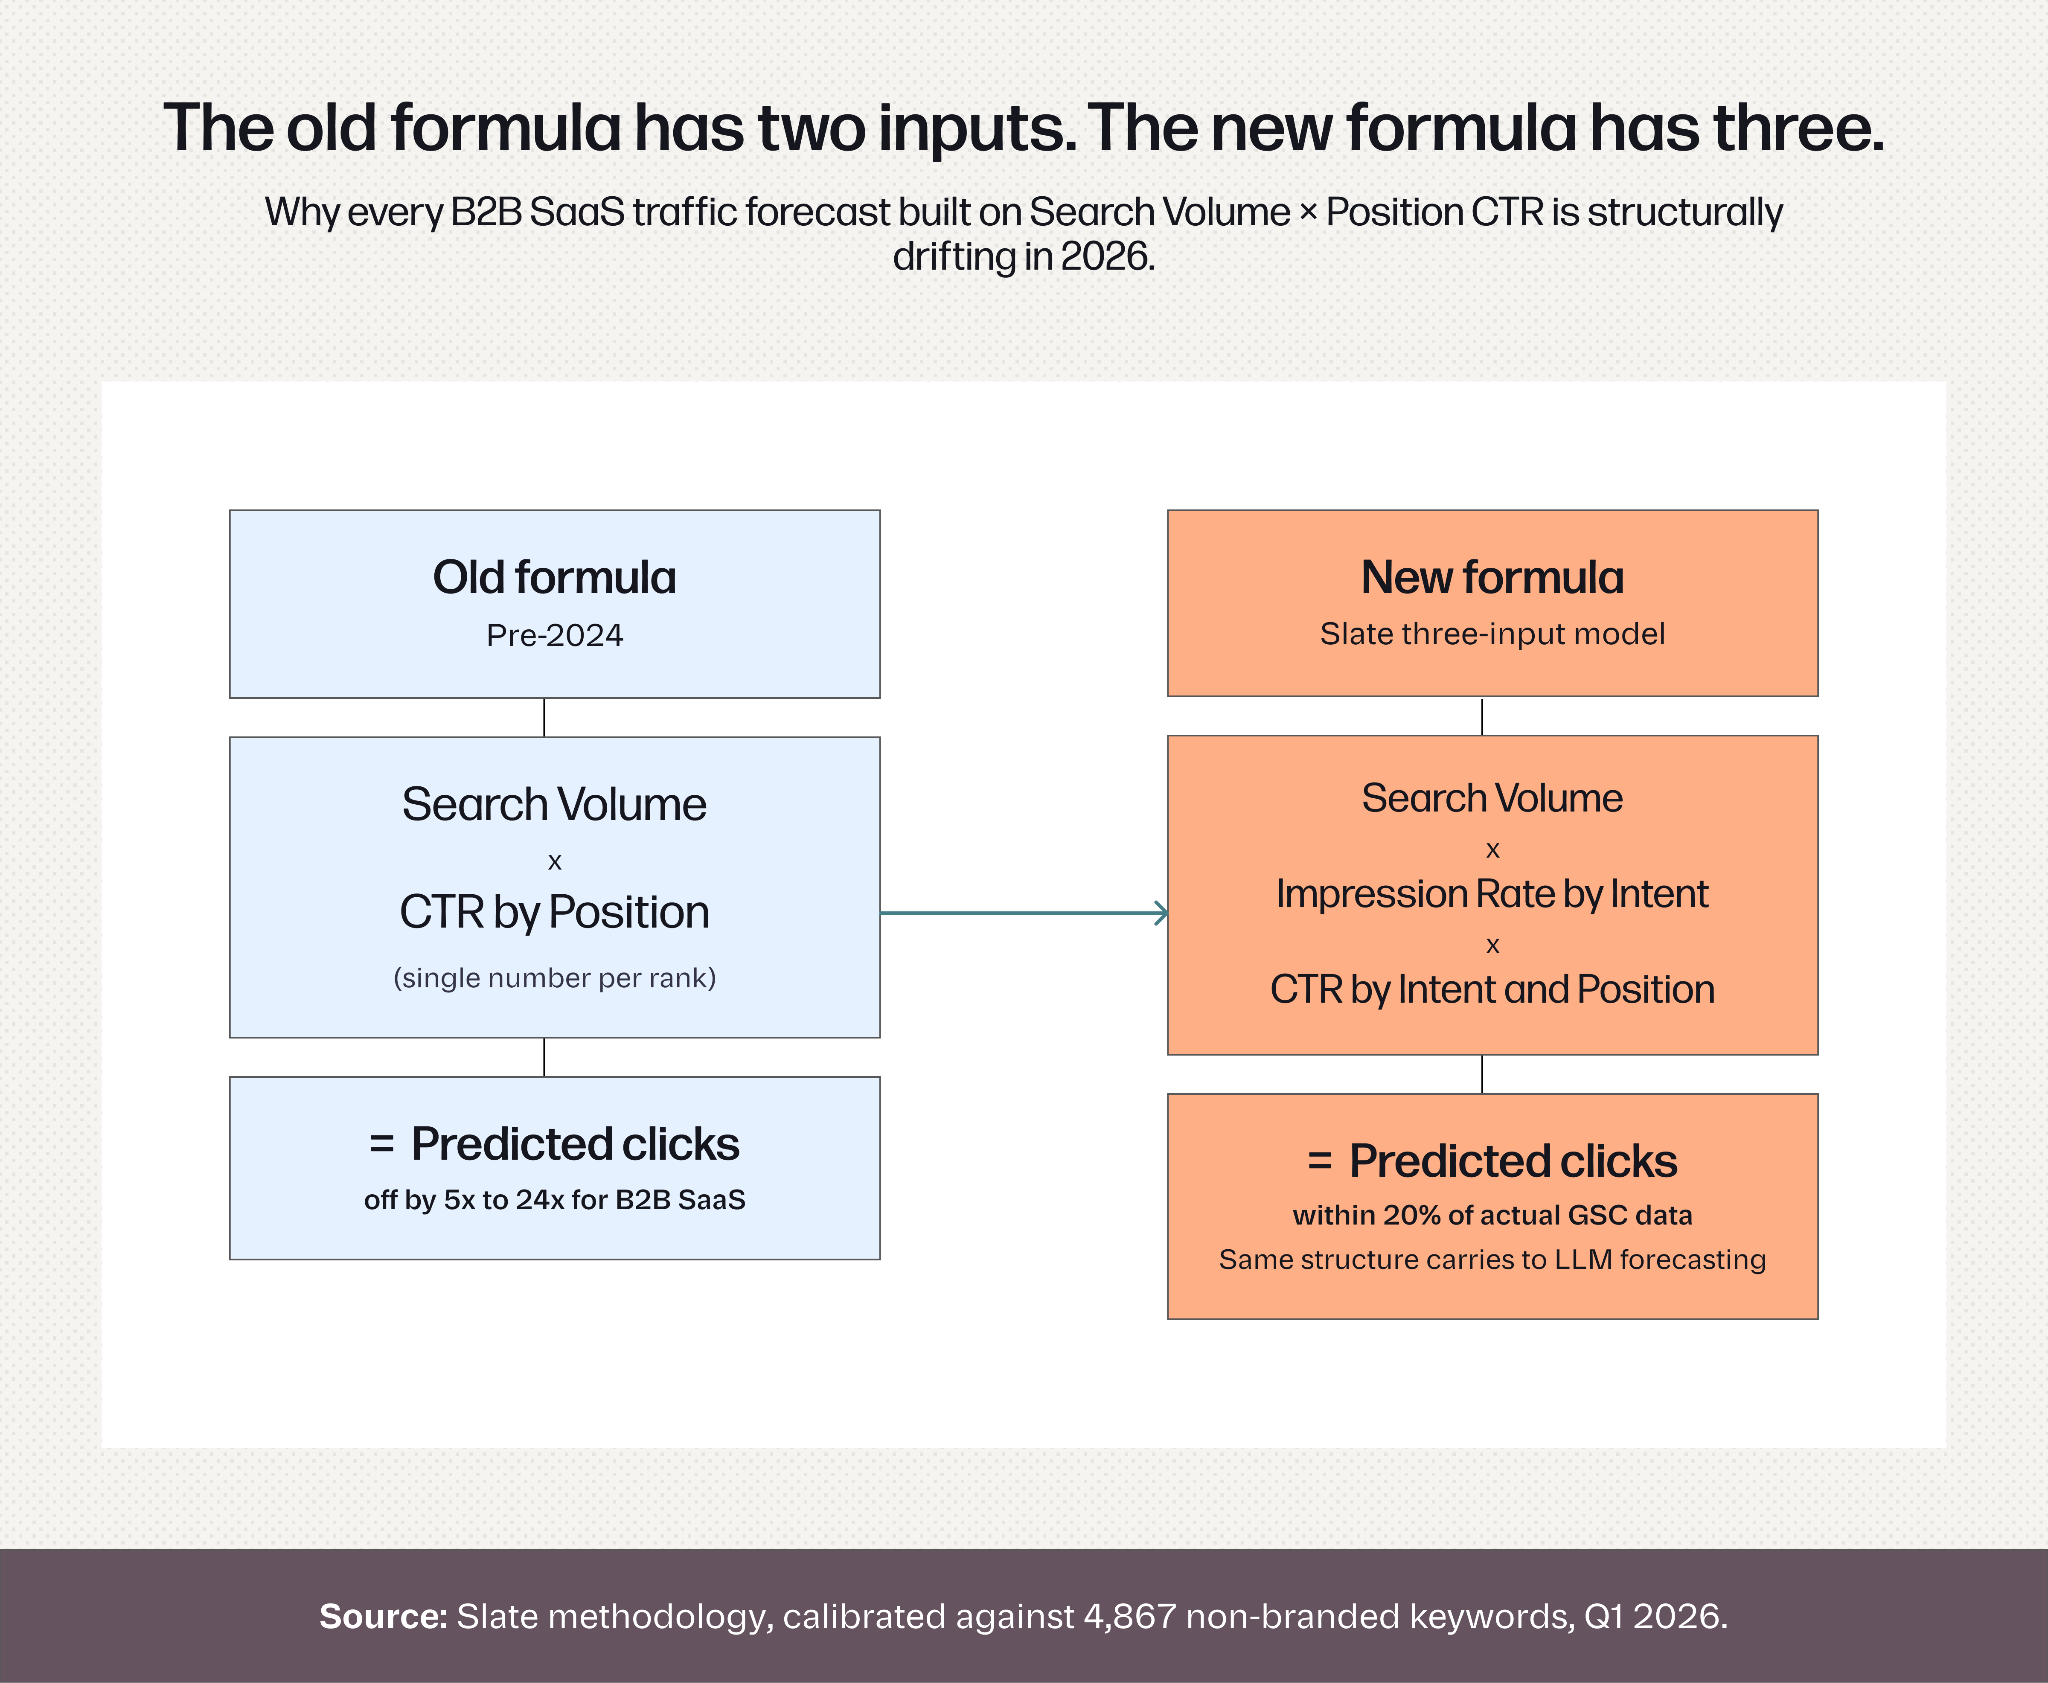
The “fix” is simple in concept. The old two-input formula gets replaced by a three-input one that uses your own GSC data instead of third-party defaults. The full table and the worked example are further down. First, the data that drove the rebuild.
The Full Tech CTR Benchmark by Position and Intent
Here's the master table. Every cell is impression-weighted across 4.5M total impressions in the dataset. Larger keywords influence the cell value more than smaller ones.
Backlinko (2024) and Semrush State of Search. Includes branded navigational queries and all verticals, which inflates the curve relative to non-branded.
A few patterns worth flagging before we dig in.
- The measured numbers sit nowhere near the public benchmark.
- The curve inside each intent has its own shape.
- Position #5 in particular behaves wildly differently across intent types, and it's where most quiet forecast misses live.
The next sections walk through each intent curve and what's driving its shape.
Intent Type Tells You More Than Position
A keyword's CTR is predicted more reliably by intent type than by SERP position. The spread at the same rank is wide enough that grouping intents under one curve produces a forecast number with no decision value.
Picture two pages, both at position #5. The first is an informational head term ("what is capex"). The second is a tool query ("capex template").
The first ships 0.48% CTR. The second ships 6.46%. Same rank, 13x different result, set entirely by what the user is trying to do.
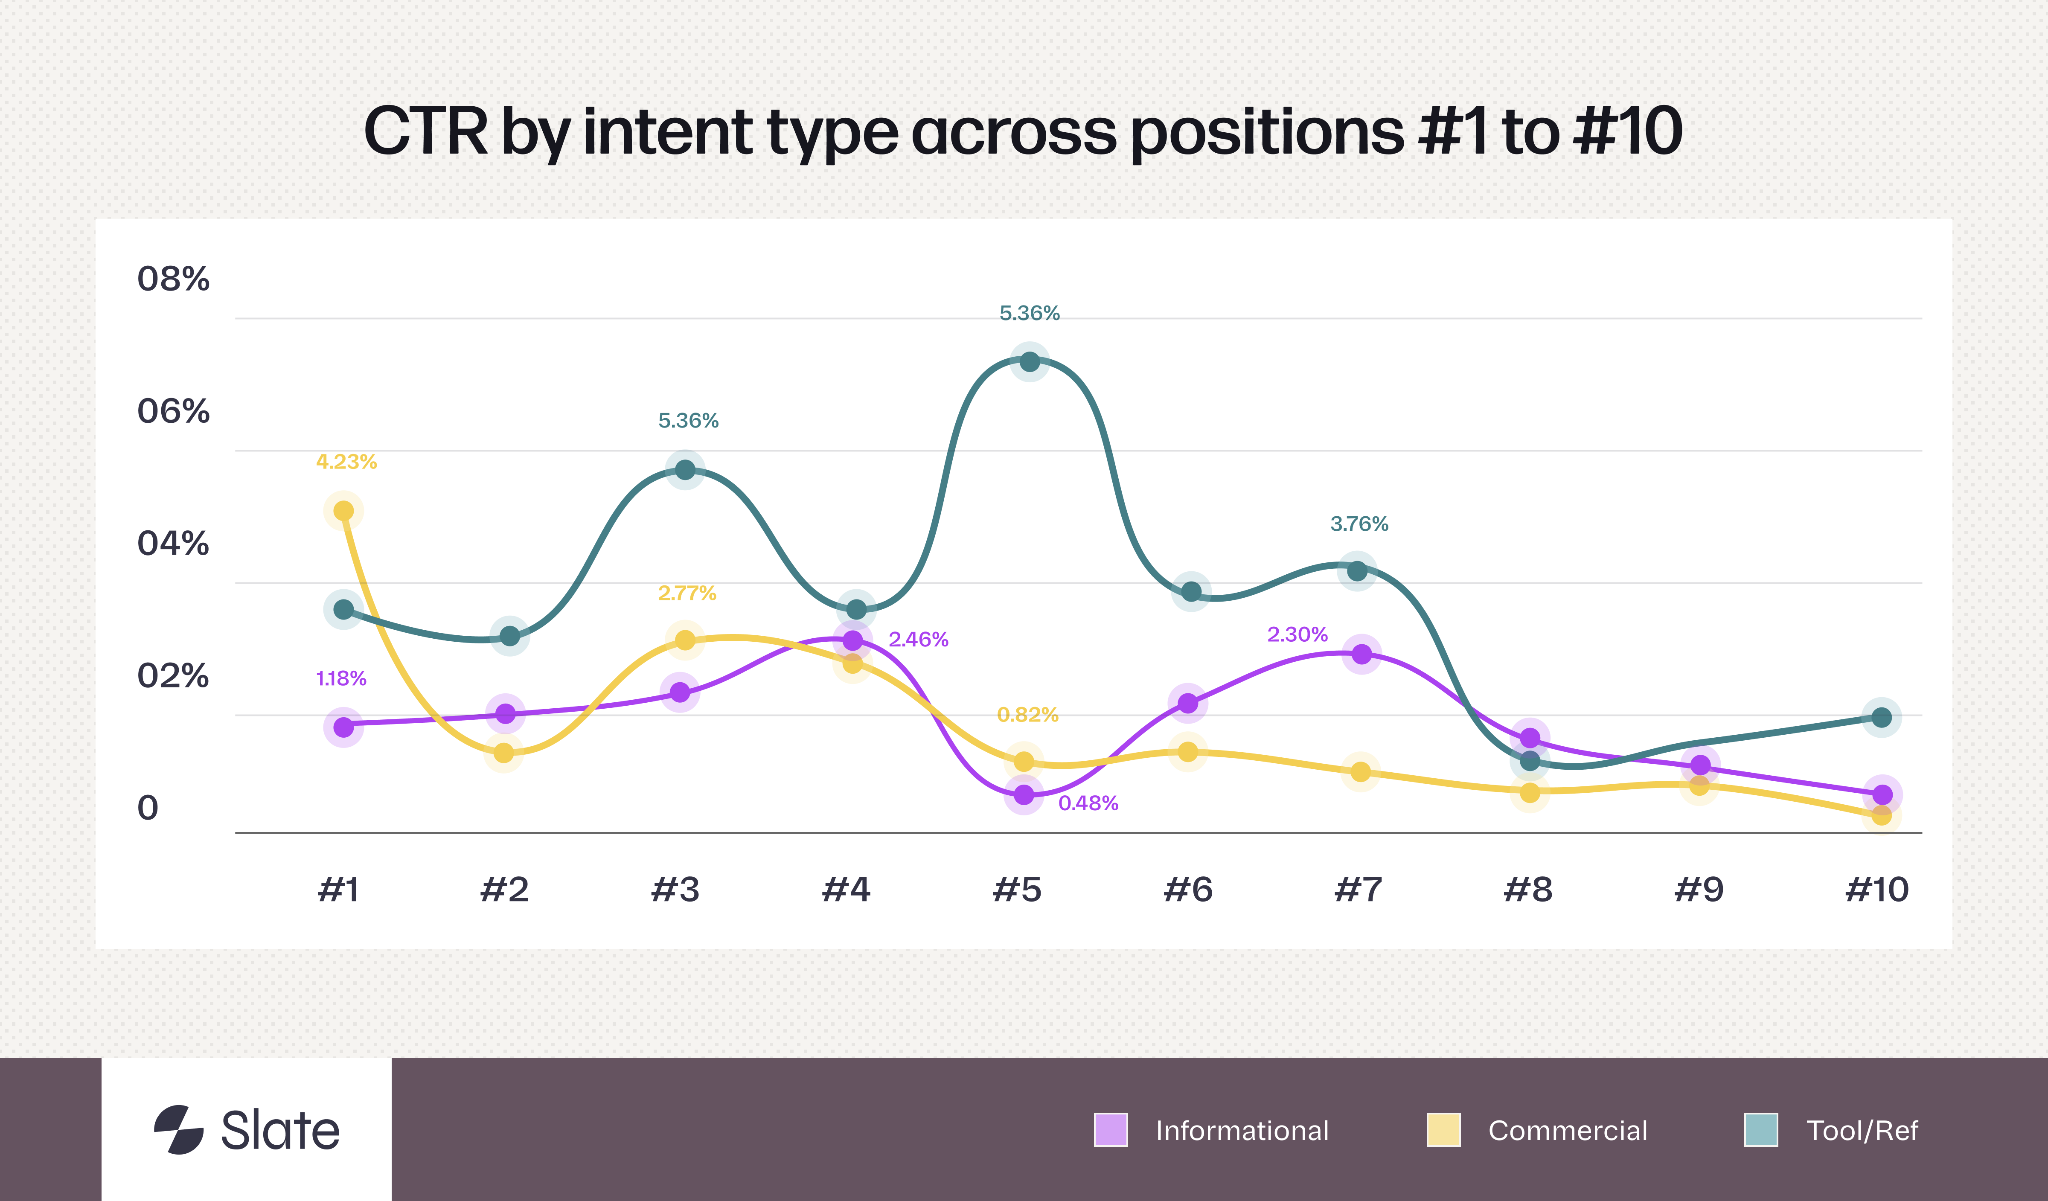
The pattern flips again across the top of the curve. Commercial intent at position #1 ships 4.23%, the highest CTR in the dataset at that rank. Informational at position #1 ships 1.18%, which is barely better than informational at #6.
Tool sits in between at 2.83%, but climbs to 6.46% at #5 (which we'll get to).
The takeaway: one CTR curve cannot serve three intent types. The next three sections walk through what each curve looks like and why.
AI Overviews and the Informational Content Problem
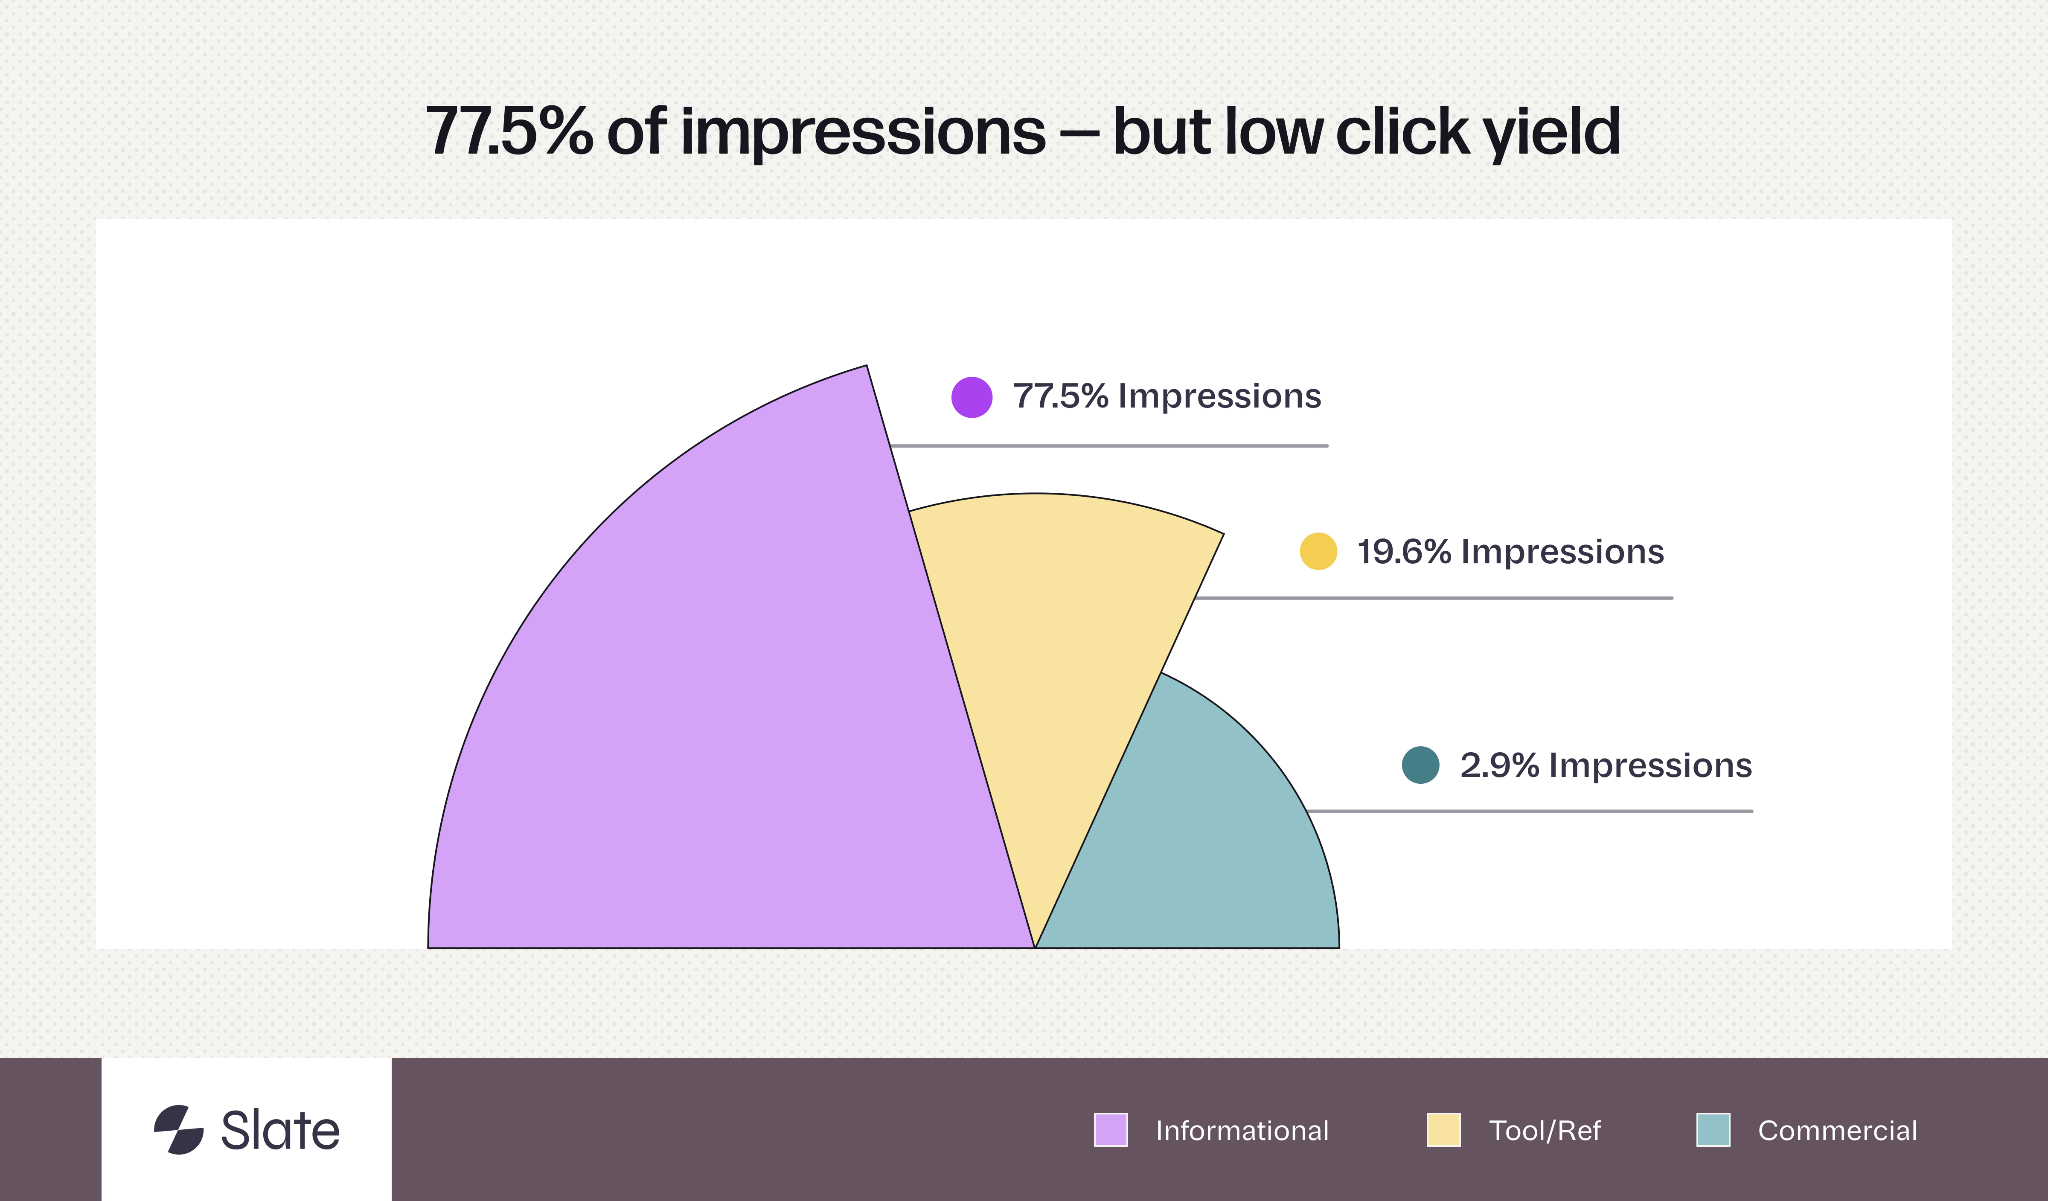
Informational queries make up 77.5% of impressions in this dataset and 1.65% weighted CTR across all positions. That's the largest pool of content by volume and the smallest by click yield. It's also the category most thoroughly hit by AI Overviews.
The Digital Bloom measured the gap directly: organic CTR drops from 1.62% to 0.61% on queries with AI Overviews present. That's a 62% reduction, and it lines up with what we're seeing on the informational side. (If you're trying to claw some of that back, the AI Overview optimization tools we shortlisted are a good starting point.)
Inside the informational bucket, three sub-types behave very differently. We classified every keyword and measured each.
Head Terms: Big Volume, Small Yield
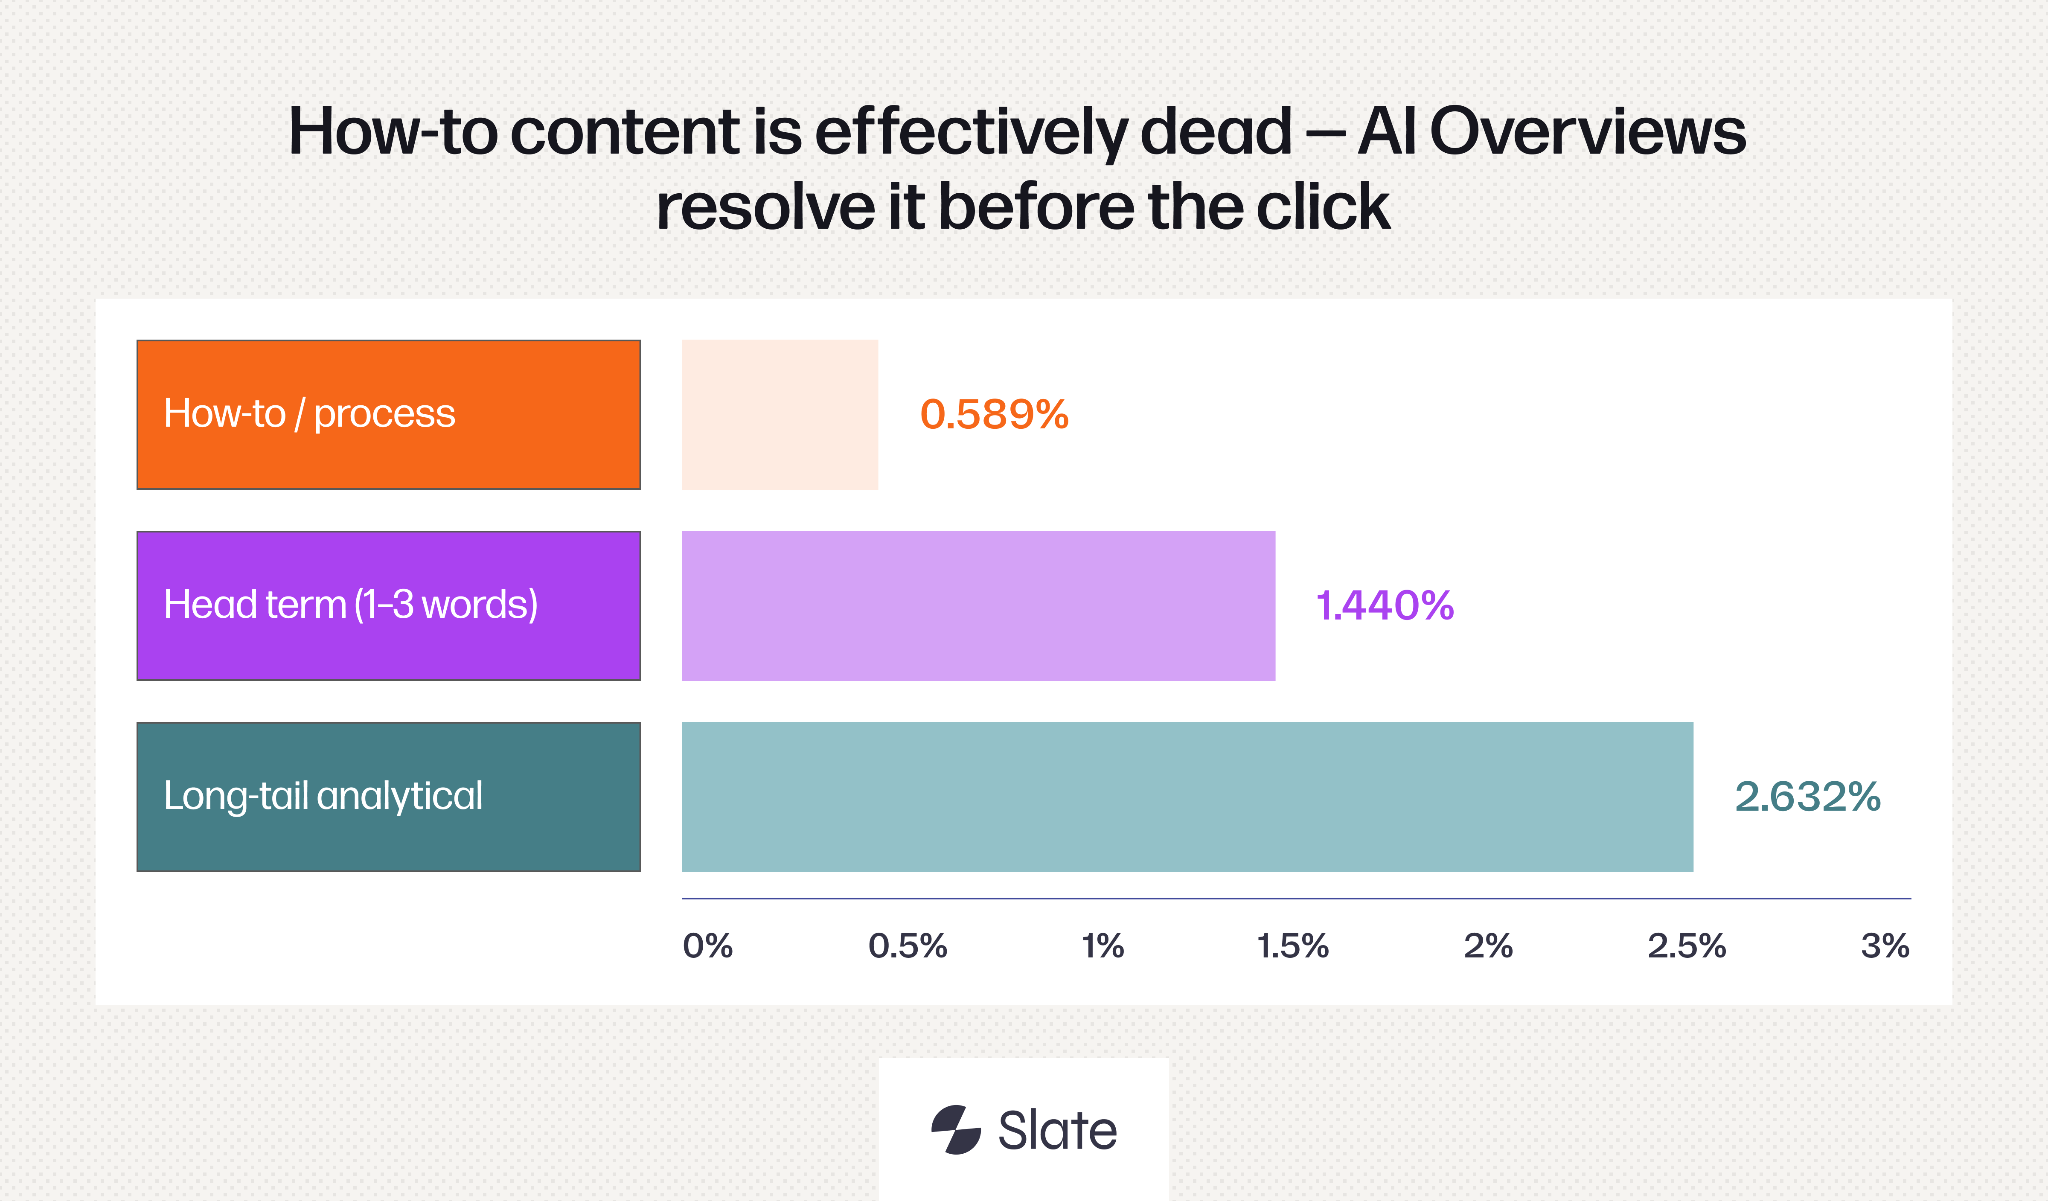
Head terms are one or two-word queries (capex, signature, faq, activity log). They show 1.44% weighted CTR across 1,920 keywords and 2.69M impressions.
The aggregate looks healthy. The long tail inside it doesn't.
Capex at position #5 delivered 70,868 impressions and 20 clicks across Q1. Faq at position #7 delivered 90,279 impressions and 182 clicks. The AI Overview answers head-term queries inline. The user reads the definition in the SERP and never sees your URL.
How-To Content: The Hardest Hit
How-to queries ship 0.59% weighted CTR, the worst of any sub-type. The clearest case in the data: how to start a business drove 24,000 impressions at position #2 and zero clicks during Q1 2026. How to become a freelancer drove 26,000 impressions at position #10 and zero clicks.
The pattern surprised us a little. Most teams assume head terms suffer most from AI Overviews because the answer is so short. The data says the opposite.
AI Overviews resolve step-by-step content more completely than they resolve definitions. The user gets the steps inline and never lands on the page.
Long-Tail Analytical: Where Clicks Still Live
Long-tail analytical and definitional queries ship 2.63% weighted CTR across 2,316 keywords. Examples include pros and cons of qualitative research, limitations of vertical analysis, and offences under IT Act 2000.
These queries are specific enough that the AI Overview gives only a partial answer. Users click through for the structured breakdown. This is the corner of informational content where traffic still arrives.
What This Means for Your Informational Strategy
Informational content is no longer a pure traffic play. For any informational keyword above 5,000 monthly impressions, expected CTR sits below 0.5% regardless of position. That math means a keyword needs 200,000 monthly impressions to drive 1,000 clicks. Few do.
The reframe is that informational content has become an authority asset, not a traffic asset. The traffic value has migrated to ChatGPT, Perplexity, Gemini, and Claude. Slate's AI citations research shows the same migration from a different angle.
Content ranks differently in the citation pool than in the click pool, and the metrics need to reflect both. The LLM optimization tools we evaluated do the tracking and surface the gaps.
The success metrics for informational content in 2026 look like this:
- AI citation rate, per LLM platform.
- Brand-mention frequency inside LLM responses.
- Branded search lift over the same period.
- Direct traffic from users who first met the brand inside an LLM answer.
Click volume alone misses most of what the content is doing.
Commercial Content and the Cliff at Position #5
Commercial intent queries make up 2.9% of impressions and 1.17% weighted CTR across all positions. Small share, high conversion value. A user searching power automate vs power apps, poly ai alternatives, or anaplan pricing is in evaluation mode. They convert on a different curve than informational readers.
The CTR shape behaves more like classical SEO intuition. Position #1 ships 4.23%, position #3 ships 2.77%, then position #5 collapses to 0.82%. The Backlinko curve has the right shape for commercial intent. It's just compressed by a factor of seven.
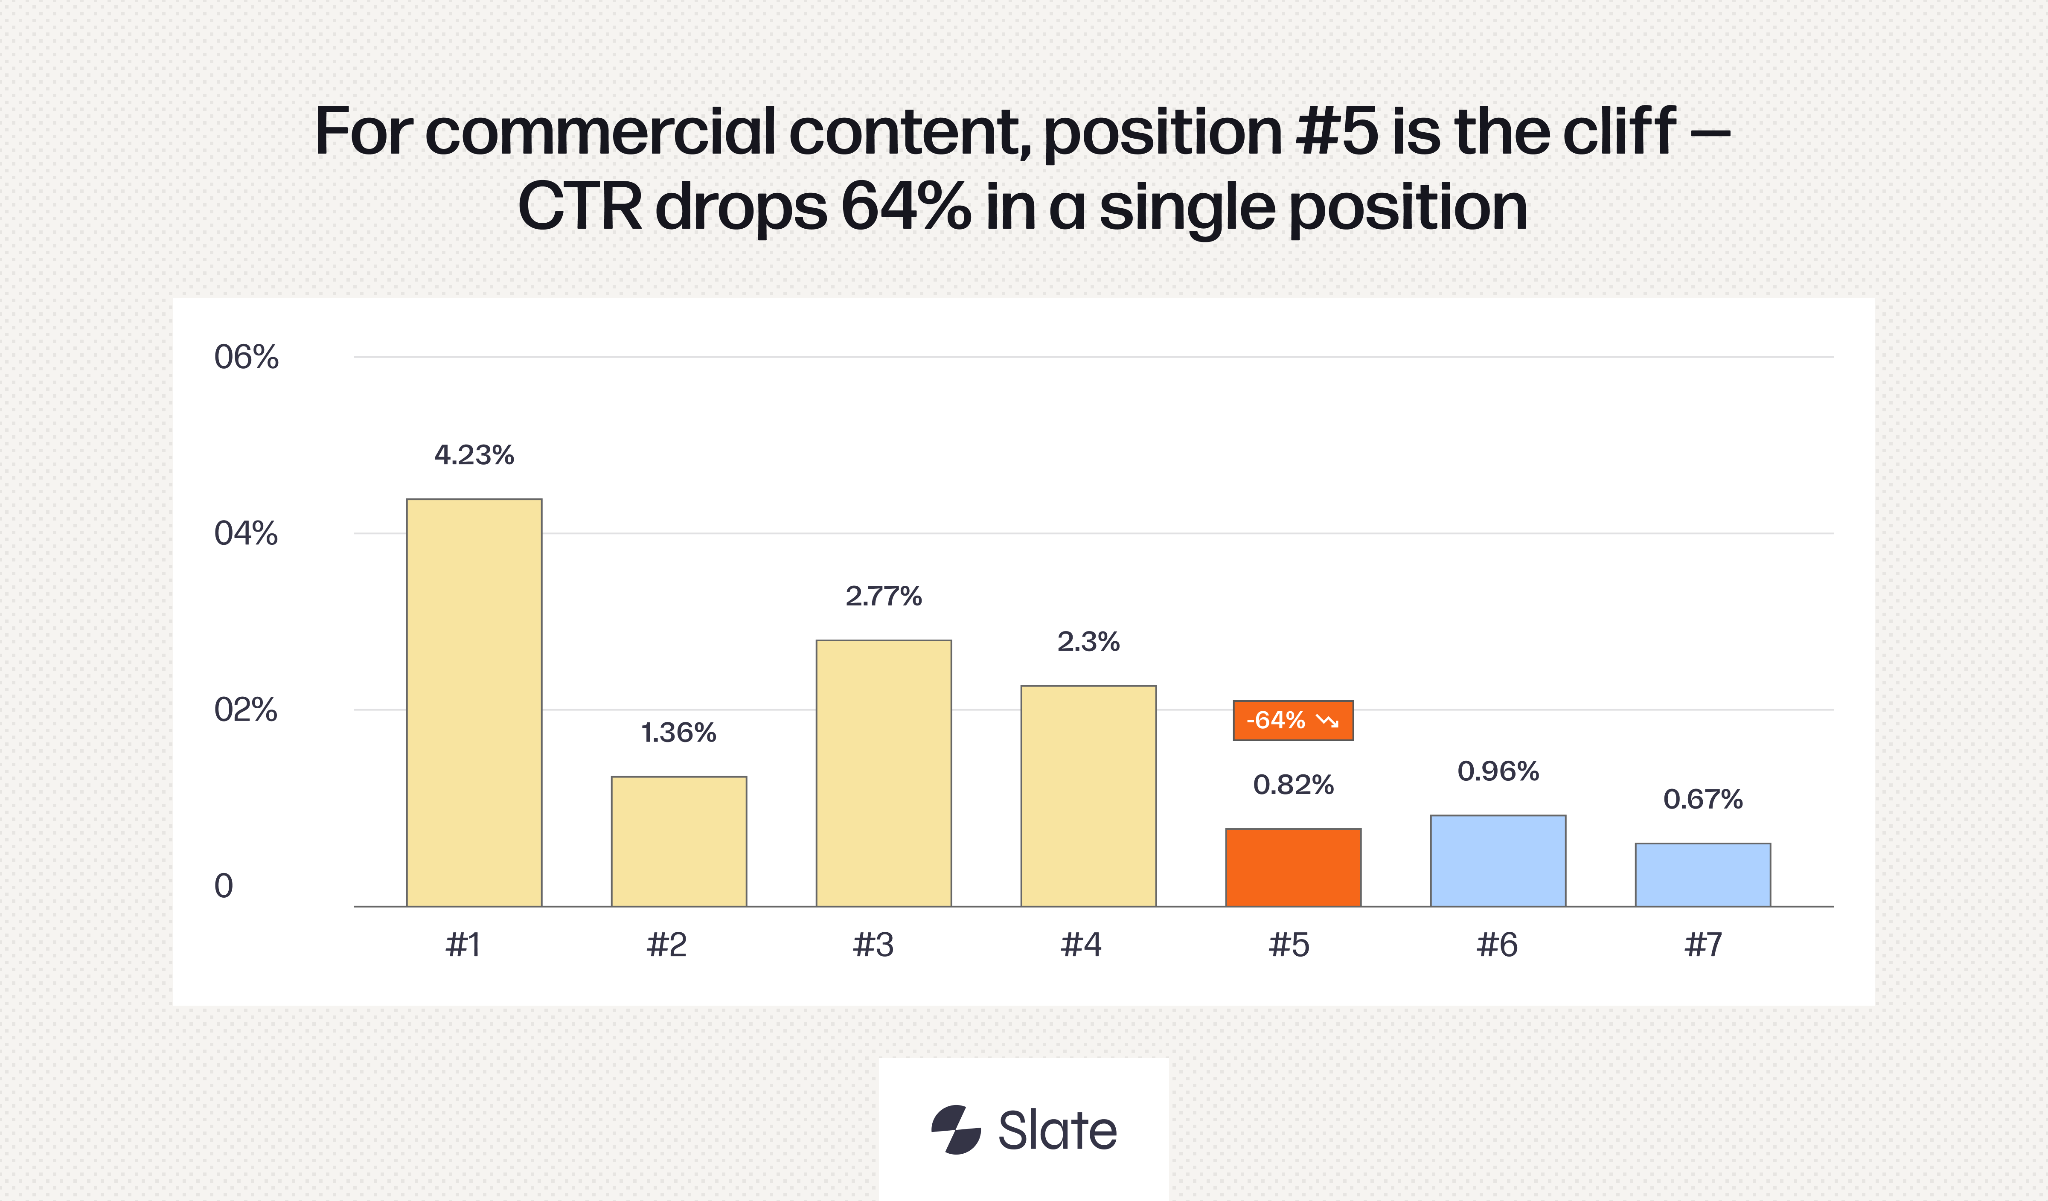
The drop from #4 (2.30%) to #5 (0.82%) is 64% in a single position, the largest adjacent-position drop in the commercial curve. That's the cliff. And it's where most commercial forecasts quietly miss.
Why Position #5 Is the Cliff
Position #5 is where the SERP folds on desktop. AI Overview boxes and Google Ads units push organic results below the visible area, especially on high-commercial-intent queries where advertisers are bidding aggressively.
A page sitting at #5 looks fine on a ranking report and ships about a third of the clicks of the same page at #4.
For forecasts, that means the #4 to #5 boundary is a cliff, not a gradient. If you have commercial pages clustered at #5, the budget question becomes binary. Push them up to #4, or move investment to pages already in the top four.
Reviews Outperform Pricing (Counterintuitively)
Inside commercial intent, sub-types vary in ways that surprise teams.
Reviews lead. Most teams concede review-intent queries to G2, Capterra, and Trustpilot and never invest in their own.
The data says when a brand's content does rank for review queries, it captures intent that competitors aren't actively defending. There's a quiet opportunity hiding in plain sight.
Pricing trails. The mechanic is that AI Overviews now surface top-line price ranges directly in the SERP. Users get partial pricing without clicking. The work-around is to push pricing pages toward specific qualified queries ([product] pricing for enterprise, [product] pricing vs [competitor]) instead of generic head terms.
What This Means for Your Commercial Strategy
For commercial content in 2026, three variables drive forecast accuracy:
- Position, especially the #4 to #5 boundary.
- Sub-type, with reviews and comparisons outperforming pricing.
- AI Overview presence, which compresses the curve from above and below.
If your commercial cluster sits at #5, the binary is invest enough to push to #4 or re-route the budget to commercial pages already in the top four. Either move makes sense. Sitting at #5 and hoping for the forecast to come true does not.
Tools and Reference Content: The Last Reliable Click Channel
Tool and reference is the one content category whose CTR has held up year over year. We cross-checked our numbers against the SeoSherpa SEO statistics digest for 2026, and the trend matches.
The reason is structural: AI Overviews can't substitute the click. A user searching capex template needs a file. A user searching DNS lookup needs a working tool. A user searching one party consent states needs a complete list. None of those resolve inline.
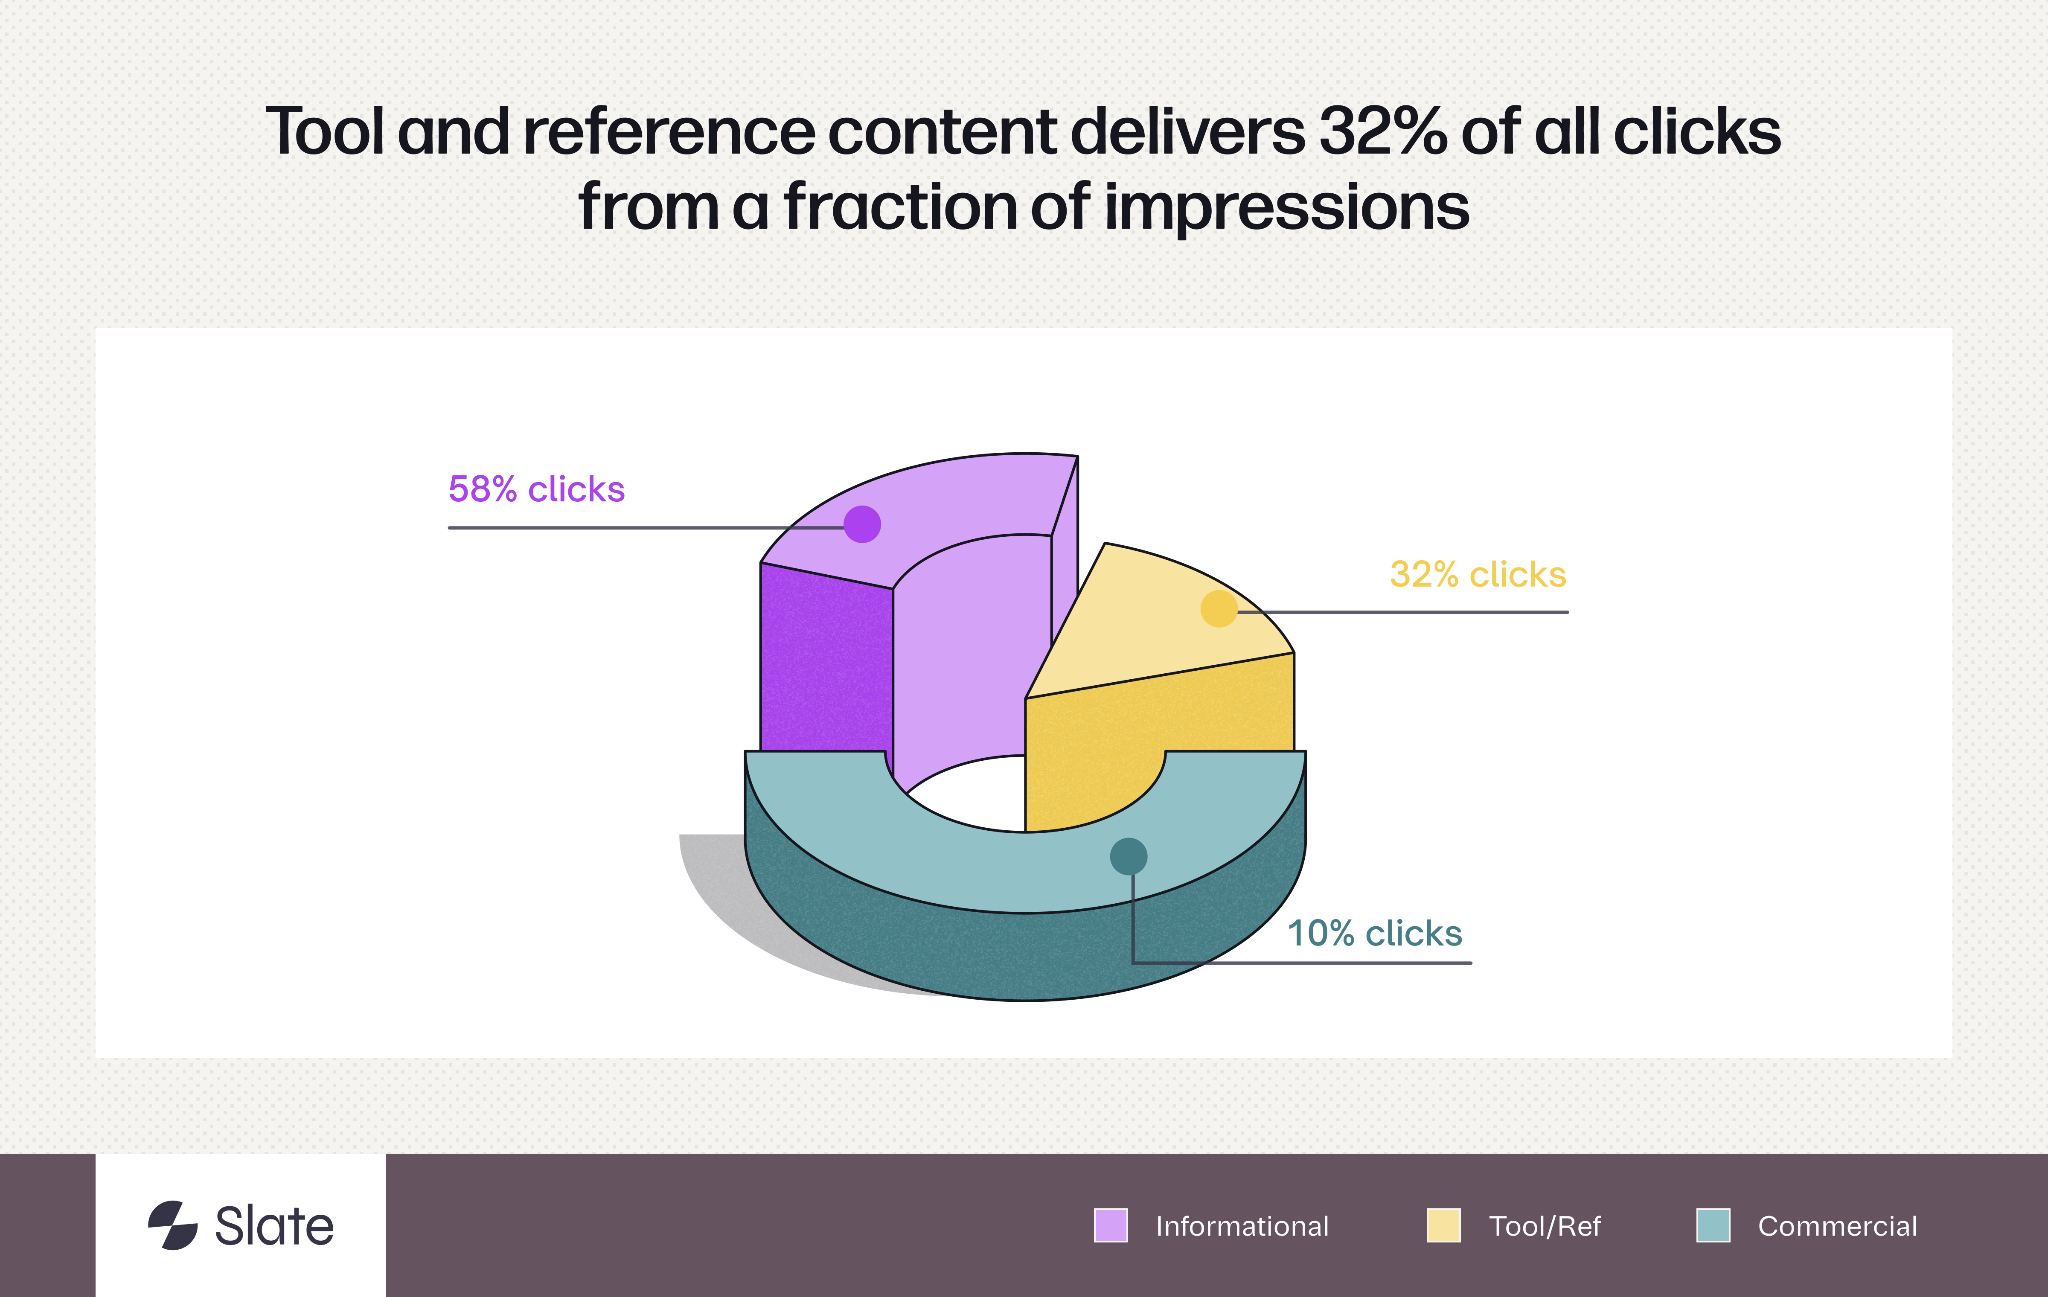
The result shows up in the data. Tool and reference queries pull a small share of impressions but capture 19.6% of all clicks in the dataset. Weighted CTR sits at 2.49%, 51% higher than commercial intent and 51% higher than informational intent.
Why Position #3 Beats Position #1 for Tool Content
Tool content is the only intent where the position curve inverts. Position #3 ships 5.36% CTR, position #5 ships 6.46%, position #7 ships 3.76%. All three are higher than #1 (2.83%) and #2 (2.36%).
We tested the pattern across 93 template keywords at position #4 from eSignature and FP&A verticals, plus checker keywords from cybersecurity and email infrastructure. Same shape every time. Two structural reasons explain the inversion.
Incumbent displacement. Positions #1 and #2 for tool queries are dominated by category-defining incumbents. MXToolbox owns DNS lookups. Smallpdf owns PDF signing. DocuSign owns eSignature. Smartsheet and HubSpot own a meaningful share of templates.
Users who scroll past those incumbents are more deliberate. They're comparing alternatives, looking for a domain-specific tool, or hitting a need the generic option doesn't serve. Sharper intent, higher engagement readiness, higher CTR.
Mobile compression. AI Overview boxes and Google Ads units push organic results below the first scroll for tool queries on mobile. Position #3 is functionally the first organic result a mobile user sees.
There's a structural floor on CTR at #3 for tool content that doesn't exist for informational or commercial content, where the SERP is less crowded above the fold.
Sub-Type Breakdown for Tool / Reference Content
Tool / reference isn't monolithic. Some sub-types are holding up. Others are losing ground.
Checkers and generators are the most defensible asset. The user knows exactly what they need (DNS check, SPF lookup, signature generator) and has to click the tool to get it. There's no partial AI Overview answer.
Templates are losing the moat. High-DR domains (HubSpot, Smartsheet, Monday) commoditized the format, and AI Overviews surface free download alternatives directly in the SERP. The competitive moat that used to protect template content has thinned.
What This Means for Your Tool Content Strategy
For any major topic cluster in your category, build one technical tool. A checker, a validator, or a generator out-performs ten how-to guides at the same impression volume.
It also pulls backlinks faster, returns users more often, and builds branded recall without branded searches.
The asset to build is intent-specific to your category:
- Cybersecurity vendors should build checkers (DNS, SPF, DKIM, port scan).
- FP&A vendors should build templates (CapEx, OpEx, rolling forecast).
- HR tech vendors should build reference lists (state-by-state employment law, salary benchmarks).
- Voice AI vendors should build generators (script, prompt, voice prompt).
The format doesn't need to be original to your category. The execution does. Slate's coverage of AI visibility tools walks through the analytics layer that pairs with the asset side, and the generative engine optimization tools shortlist covers the GEO side.
How Off Are Traditional CTR Benchmarks?
The size of the miss varies by cell. Below is the overestimation factor for traditional CTR benchmarks across intent and position.
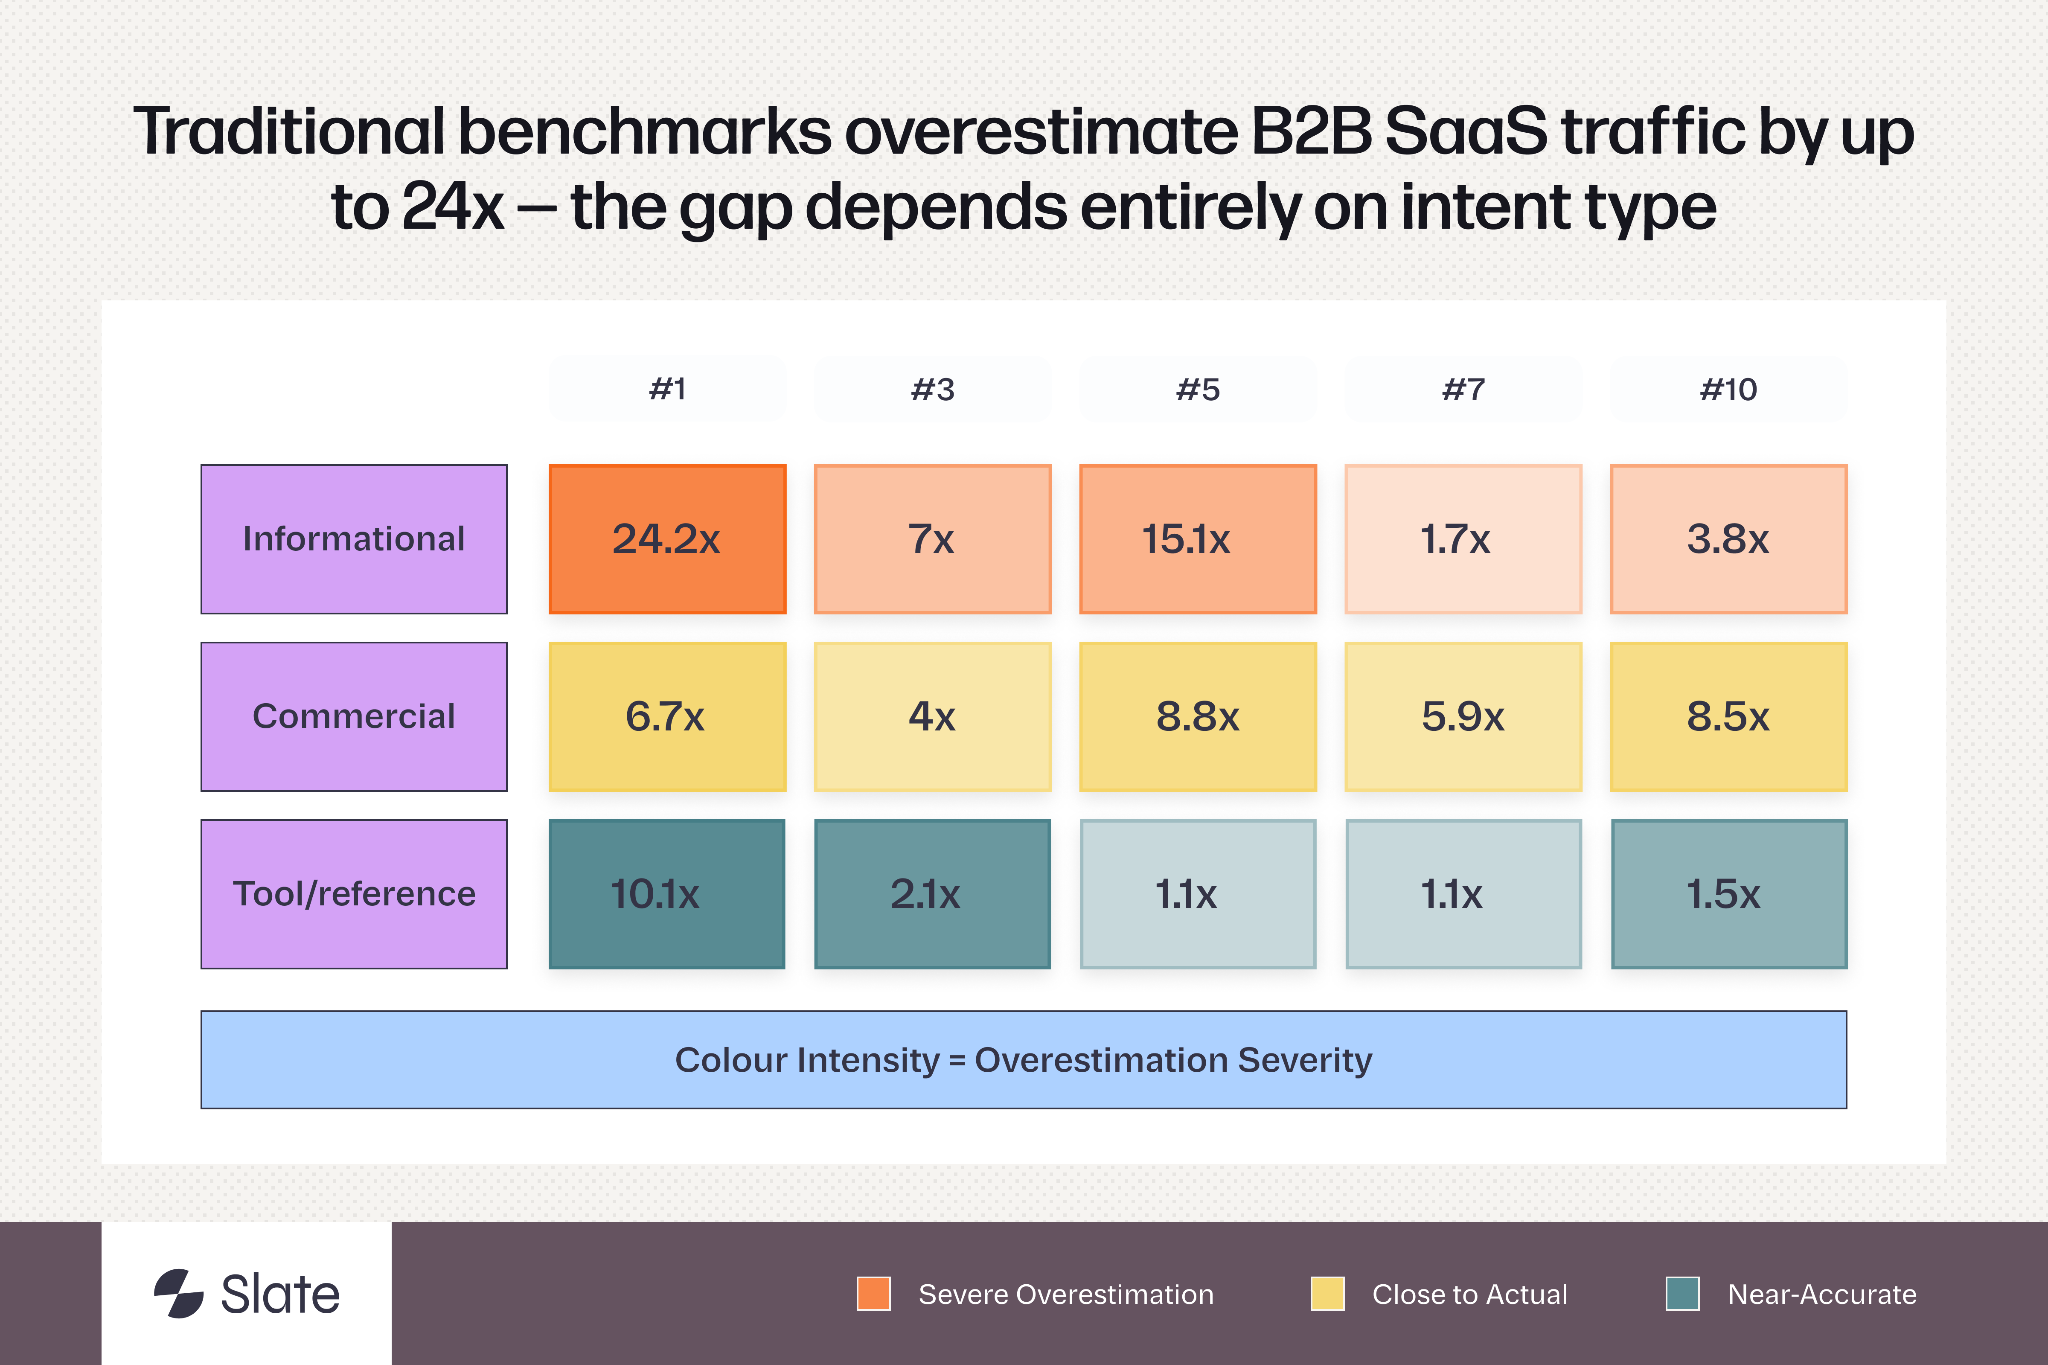
Three cells stand out.
Informational at position #1 (24.2x). A glossary or definition page ranking at the top ships about 1/24 the clicks the public benchmark predicts. Forecast 1,000 monthly clicks, expect 41.
Commercial at position #5 (8.8x). Stack this on top of the position #5 cliff and you get a cell where forecasts are quietly very wrong. The page reads as ranking, the clicks don't arrive, and nobody can explain why.
Tool / Reference at #3 to #7 (1.1x to 2.1x). This is the only band where the public benchmark is approximately right. Forecasts for tool content at mid-page positions usually land within 30% of actuals. If your portfolio is heavy on tool / reference content, your forecasts have probably been holding up better than your peers'.
A worked example using a real keyword we anonymized. A B2B SaaS brand ranks at position #3 for what is capex with 70,000 monthly impressions.
- Public benchmark projection: 11.0% × 70,000 = 7,700 clicks per month.
- Actual performance from our dataset: 0.03% CTR × 70,000 = 21 clicks per month.
The plan is off by 366x. A 366x miss reshapes every downstream decision. Whether to invest in more glossary content, push budget into tool pages, or expand commercial coverage all change depending on which number set the plan.
Now to the second input the formula gets wrong.
Why Search Volume Is No Longer 1:1 with Impressions
Search volume from Ahrefs is not the same as impressions on your URL. The ratio between them, which we'll call impression rate, has decoupled from 1:1 and now varies by intent more than by position.
We measured impression rate across 194 non-branded keywords with both US Ahrefs volume and US Search Console impressions for March 2026. We grouped by intent and computed the medians.
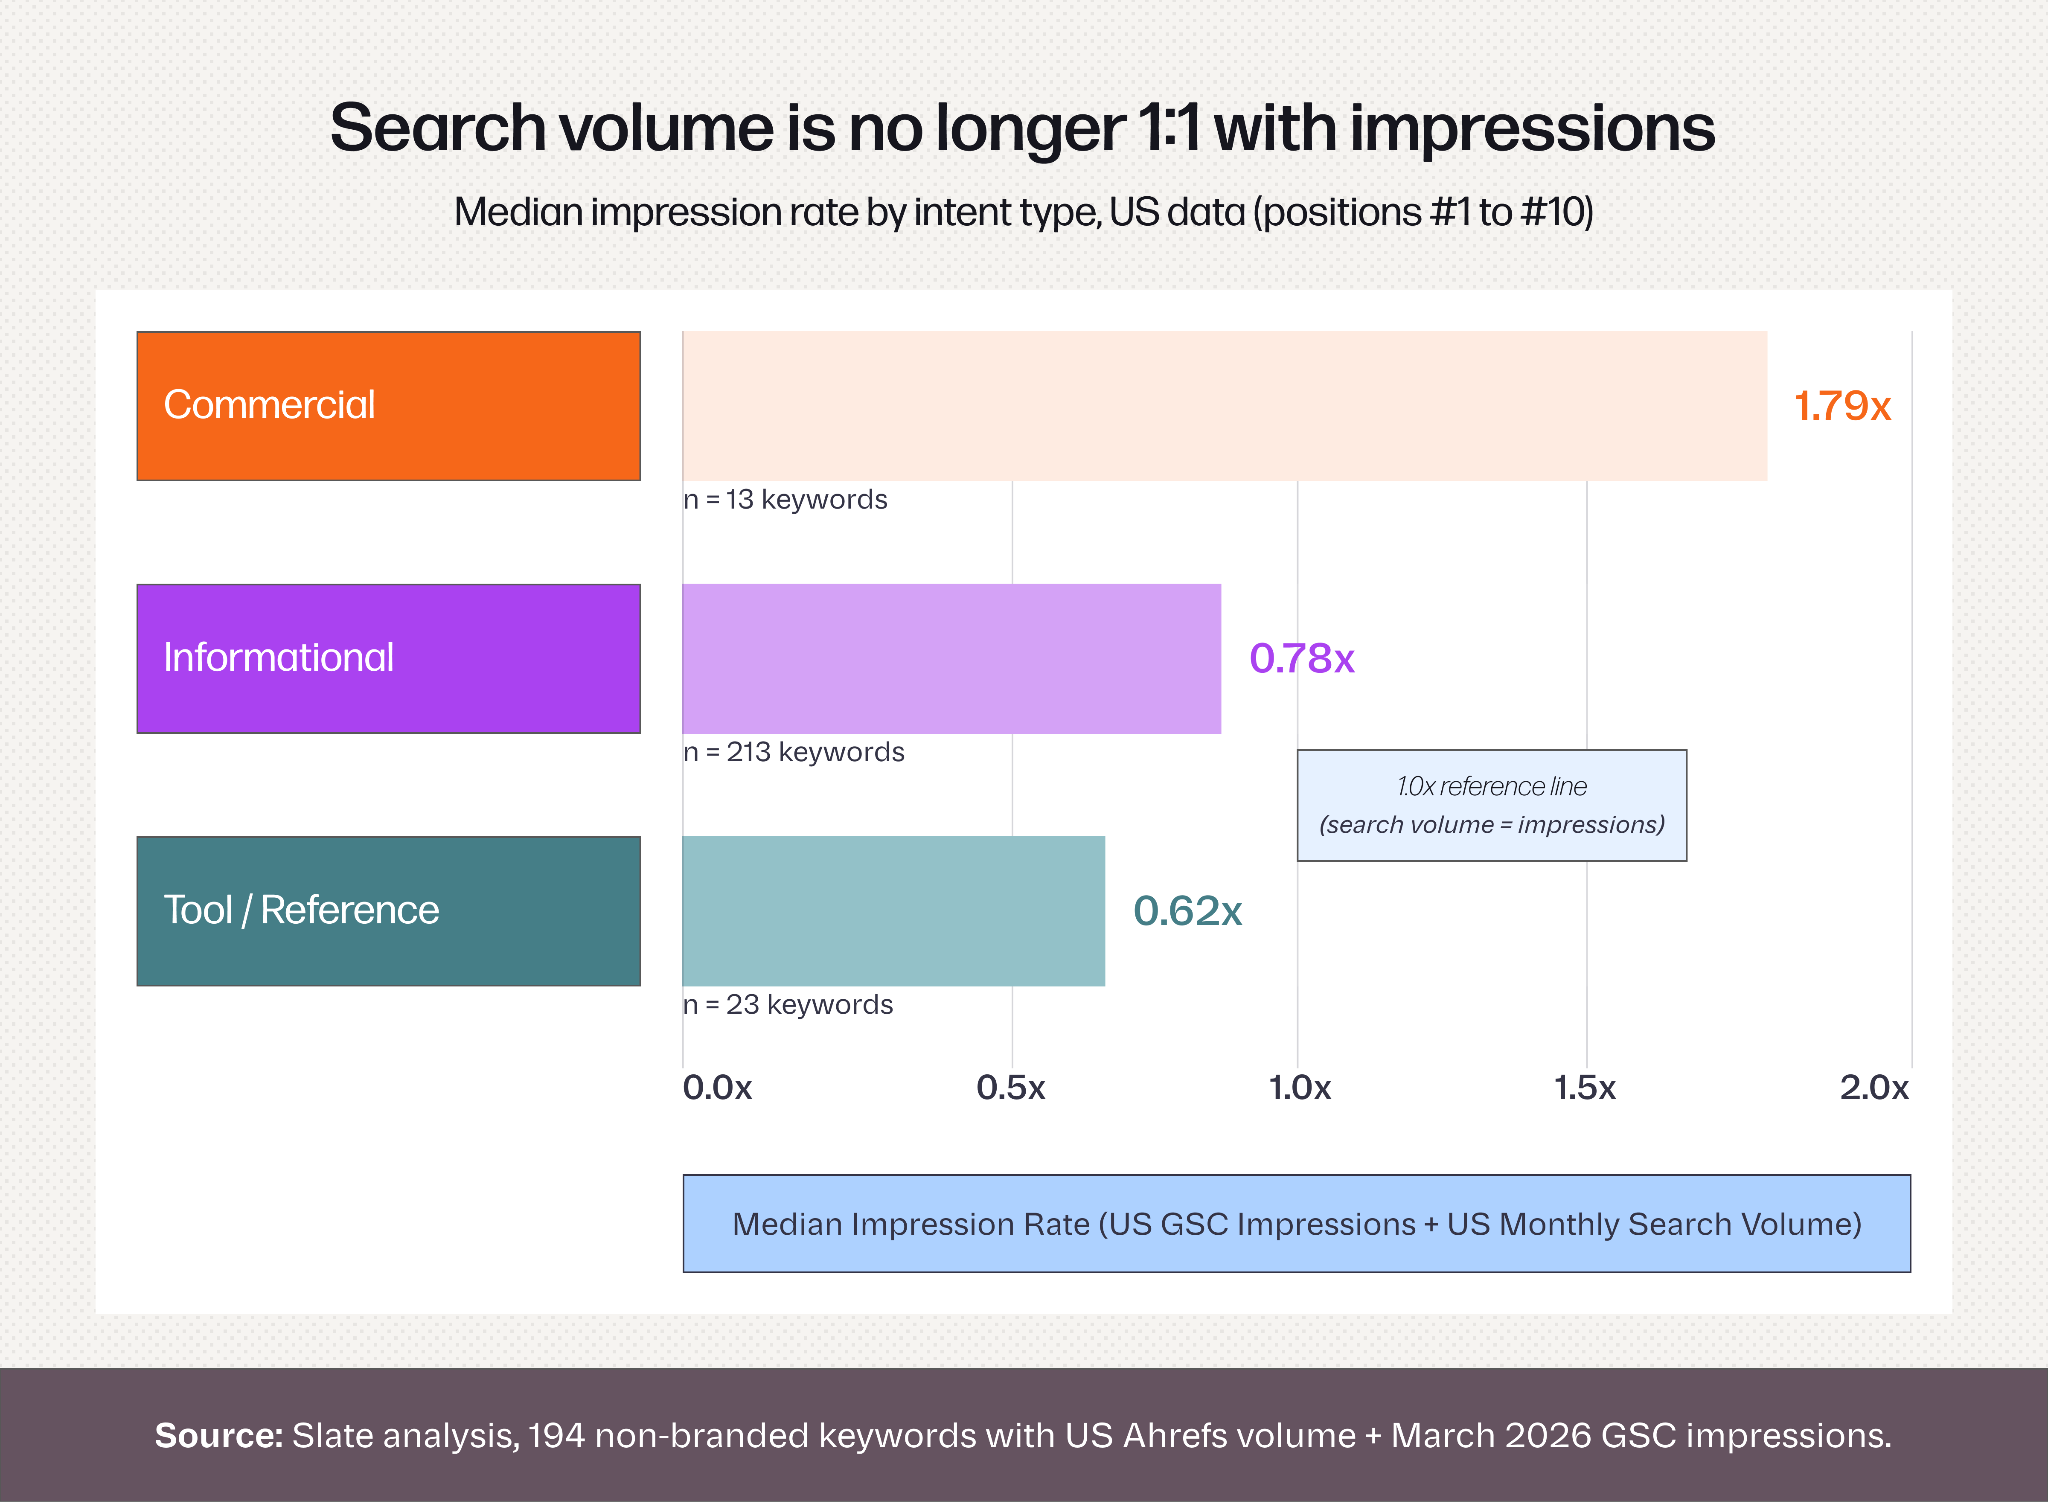
Two patterns are worth calling out.
The spread is wide enough that a flat 1.0x assumption produces a forecast error of plus or minus 30% before CTR even multiplies in. So if your forecast is currently treating Ahrefs volume as if it equals impressions, you have a baked-in 30% error before you multiply anything.
The direction of the error reverses by intent. Plug a tool / reference keyword in at 1:1 and you over-forecast impressions. Plug a commercial keyword in at 1:1 and you under-forecast them.
The fix is to pull impression rate by intent from your own GSC data and use that, not the third-party reported volume.
The New Traffic Forecast Formula (with a Worked Example)
The new forecast has three inputs. Every input is intent-conditional. The structure looks like this:
Predicted Clicks per Month =
US Search Volume
× Impression Rate by Intent (median)
× CTR by Intent and Position (mean)
Let's walk through a worked example using a live keyword from the dataset.
The keyword is recruitment strategies. Intent is informational. US monthly search volume from Ahrefs: 5,500. Position target: #3.
Step one. Pull the impression rate for informational. Median across 213 keywords is 0.78x.
Step two. Predicted impressions = 5,500 × 0.78 = 4,290 / month.
Step three. Pull CTR for informational. The position-specific mean at #3 is 1.57%. The conservative across-position mean is 1.33%.
Step four. Predicted clicks land in a range: 4,290 × 1.33% = 57 / month at the conservative end, 4,290 × 1.57% = 67 / month at the position-specific end.
The same keyword run through the traditional formula returns 5,500 × 11.0% = 605 clicks per month. The new formula returns somewhere between 57 and 67. The traditional formula is off by roughly 10x, which lines up with the average informational overestimation factor (10.3x) in the matrix above.
Lookup Tables to Drop Into Your Forecast Spreadsheet
Impression rate (median) by intent:
CTR (mean) by intent and position: the master matrix above. Use the cell that matches your intent and target position.
Two practical notes on using the model. The impression rate is sensitive to your geography and the SERP feature density in your category. The medians above are US-only, and international data tends to run 0.7x to 0.9x lower because AI Overview saturation is uneven across countries.
The CTR matrix is non-branded only. Blending branded queries in moves the curve upward.
The model is deliberately simple. Three inputs, two lookups, one multiplication. Every assumption traces back to first-party GSC data, which makes the number defensible in a budget meeting. (Slate's Glean case study is a real example of the model running against a 275% organic traffic lift, with the inputs broken out by intent.)
What This Means for LLM and AEO Traffic
The same three-input structure applies to LLM citation forecasting, with three different inputs. Where Google forecasting uses search volume × impression rate × CTR, LLM forecasting uses prompt volume × citation rate × destination click rate.
Each input maps cleanly to its Google equivalent.
Prompt volume is how often a query that could surface your domain is asked across ChatGPT, Perplexity, Gemini, Claude, AI Overview, and AI Mode. Slate samples this volume across platforms. (Our AI memory poisoning research covers the adjacent question of how LLMs decide which sources to trust in the first place.)
Citation rate is the fraction of those prompts where your domain appears as a cited source. It varies by topic, by platform, and by content type. Tool / reference content cites at lower rates than long-tail analytical content because LLMs prefer text-rich pages they can summarize.
Destination click rate is the fraction of users who click through from the LLM citation to your URL. Early data suggests this is lower than Google CTR by a factor of three to five. LLM clicks are scarce, and brand recognition outweighs ranking position.
The three-tier framework applies to both sides. Informational content that has stopped earning Google clicks is starting to earn LLM citations. Tool content that earns Google clicks doesn't yet earn LLM citations at the same rate. Commercial content sits in between.
A forecast that runs both models in parallel gives a content team the right portfolio view. A forecast that runs only the Google model gets two things wrong.
It overstates the cost of informational content (because it ignores the citation value). And it understates the durability of tool content (because it ignores the LLM gap that protects the moat).
What to Do With This in Your 2026 SEO Plan
Most of what comes out of this study collapses into a few operational changes. Here's the short version, in the order most teams will benefit from running them.
1. Audit Your Content Portfolio by Intent Before the Next Planning Cycle
Most tech portfolios are 70% to 80% informational by impression share, and most project clicks using a single CTR curve. The audit is to split the portfolio into three buckets (informational, commercial, tool / reference) and re-run the forecast on each.
In the customer cohorts we've worked with (and yes, our content engineering approach leans on this audit step), the re-baseline tends to:
- Drop the projected click number by 60% to 80% on the informational cluster.
- Hold the commercial cluster within 30% of the prior plan.
- Lift the tool / reference cluster by 20% to 40%.
The total portfolio number drops, but the decision-grade accuracy of every individual line goes up.
2. Stop Reporting Informational Content on Click Volume Alone
The traffic value of informational content has migrated to a different distribution channel. The right scoreboard now includes:
- AI citation rate, per LLM platform.
- Brand-mention frequency inside LLM responses.
- Branded search lift over the same period.
- Direct traffic on cluster pages from users who first met the brand inside an LLM response.
Every one of those is trackable. None show up in a default SEO dashboard, which is part of why the migration has been invisible to most teams.
3. Move Commercial Content Above the Position #5 Cliff
Commercial content at #5 ships about a third the clicks of the same content at #4. The cliff is structural, and so is the budget call.
Either invest enough in linking, refresh, and on-page work to push pages from #5 to #4, or re-route the budget to commercial pages already in the top four.
The most underrated commercial sub-type is reviews. A modest investment in branded review content (case-study format, comparison reviews, third-party-style breakdowns) often picks up clicks that competitors aren't actively defending.
4. Build at Least One Tool or Reference Asset per Major Topic Cluster
Tool and reference content is the most defensible click channel left in tech organic. A useful checker, generator, or template page out-performs ten how-to guides at the same impression volume.
It also accumulates backlinks faster, returns users more often, and builds branded recall without branded searches.
(For the production side, our AI content operations stack covers the tools that scale this without burning the team out.)
The Signeasy case study Slate published last quarter is a worked example of this play in eSignature. The signature generator and signature checker pages drove a disproportionate share of organic clicks. The same pages eventually translated into LLM citations as the AI search layer matured. Full breakdown is in the Signeasy case study.
5. Run the Refresh Pass at Scale
For most teams, the practical follow-up is a portfolio-wide refresh on the informational and commercial clusters. Doing that one URL at a time is what kills the project before it ships. Our take on AI content marketing tools covers the bulk-refresh side, and Slate Sheets is how we run the same operation across thousands of URLs in one pass.
The point is to keep the rebaseline going as a quarterly habit, not a one-off audit.
6. Recalibrate Stakeholder Expectations Before the Next Review
If your traffic projections are built on traditional CTR benchmarks, your Q1 2026 numbers will look like underperformance against a benchmark that was wrong. The conversation with the executive team or the board needs to start with that re-grounding before it can move to plan.
The cleanest framing is the 24.2x number for informational content at position #1. A team that forecast 24,000 monthly clicks from a pillar page and delivered 1,000 hit a plan that was off by an order of magnitude.
The miss happened before the work started. Naming the structural source of the gap is the prerequisite to setting next year's plan from a credible base.
Conclusion
The traffic forecast formula tech teams have run on autopilot for years has drifted hard since AI Overviews rolled out. Search volume isn't impressions. Position alone doesn't predict CTR.
Intent type explains more of the variance than rank, and the position curve inside each intent has its own shape.
The replacement model is three inputs, all pulled from your own Search Console: search volume, impression rate by intent, and CTR by intent and position. The same structure carries to the LLM side, where prompt volume, citation rate, and destination click rate replace the Google-side inputs.
The practical implication is portfolio rebalancing. Tool and reference content is the most defensible click channel in 2026 because AI Overviews can't substitute the asset.
Informational content has migrated from Google clicks to LLM citations and needs a different scoreboard. Commercial content rewards top-four rankings disproportionately and punishes position #5 more than any other adjacent boundary in the data.
We built Slate to run this same model continuously across customer portfolios. The platform does four things automatically:
- Classifies your non-branded keywords by intent.
- Pulls impression rate from connected GSC data.
- Applies the CTR matrix at the intent-and-position level.
- Runs the parallel LLM forecast against citation tracking on ChatGPT, Perplexity, Gemini, Claude, AI Overview, and AI Mode.
If you'd like to see the model run on your own portfolio, book a Slate demo and we'll plug your data in. If you want to look around first, the wider AI SEO tools landscape is a useful starting map.
Frequently Asked Questions
What is the average organic CTR at position #1 for tech brands in 2026?
For non-branded, the average CTR at position #1 is 1.80% weighted across all intent types. Inside that average, informational ships 1.18%, commercial ships 4.23%, and tool / reference ships 2.83%.
The traditional benchmark used in most planning decks (27.6% from Backlinko alone, 28.5% blended with Semrush) overstates non-branded performance by 5x to 24x depending on the cell.
Why is the measured CTR at position #1 so much lower than Backlinko's number?
Backlinko's published number blends branded and non-branded queries across all verticals and geographies. Branded navigational queries push the average up because the user typed the brand name and clicked the brand URL by intent.
Filter to non-branded only and the curve compresses by 5x to 24x.
How do AI Overviews affect tech organic CTR?
AI Overviews compress organic CTR most heavily on informational queries. Head terms and how-to content have dropped to 0.59% to 1.44% weighted CTR in our dataset.
Commercial CTR is partially compressed: the curve shape is preserved, but the magnitude shrinks. Tool and reference CTR is largely unaffected because AI Overviews can't substitute a working tool or downloadable asset.
How is intent classified in this study?
Every keyword runs through a deterministic decision tree with no manual overrides:
- Tool signal (checker, generator, template, calculator, maker, extractor)? Classify as Tool / Reference.
- Commercial signal (vs, alternative, pricing, review, best)? Classify as Commercial.
- Process signal (how to, guide to, tips for)? Classify as Informational sub-type How-to.
- Default: Informational.
Why does tool / reference content perform better at position #3 than at position #1?
Two structural reasons. Positions #1 and #2 for tool queries are dominated by incumbent category tools (MXToolbox, DocuSign, Smallpdf, Smartsheet) that capture broad-recognition clicks. Users who scroll past those incumbents are more deliberate.
On mobile, AI Overview boxes and Google Ads units push organic results below the first scroll for tool queries. Position #3 is functionally the first organic result a mobile user sees.
How do I forecast organic traffic if I don't have first-party GSC data yet?
Use the lookup tables in this report as defaults. The medians are 0.78x for Informational, 1.79x for Commercial, and 0.62x for Tool / Reference. The mean CTR matrix is derived from 4.5M impressions across 16 verticals.
Once you have 90 days of GSC data on your own portfolio, replace the defaults with your own medians stratified by intent.
Does this CTR benchmark apply outside tech?
The structural finding (intent predicts CTR more reliably than position) is general. The specific numbers (0.78x impression rate, 1.18% informational CTR at #1) are calibrated to non-branded.
E-commerce, local services, and consumer media each have their own curve and intent split. The methodology transfers. The lookup values do not.
How does the forecast change once a keyword starts attracting LLM citations?
Direct Google CTR stays roughly the same in the data we've observed. What changes is that branded search lift, direct traffic, and engaged sessions on the cited URLs all rise. The LLM citation acts as an upper-funnel touch that Google CTR doesn't capture.
The fix is to add a second model (prompt volume × citation rate × destination click rate) and report the two streams in parallel.
What's the single most useful thing to do with this study this quarter?
Run the 30-cell intent-and-position matrix against your existing keyword tracker and reforecast every cluster. The output usually drops projected click numbers for informational content by 60% to 80% and lifts projected click numbers for tool / reference content by 20% to 40%.
That reforecast alone re-routes the next planning cycle toward the categories where the clicks still are.