We found two big facts about Claude while curating this study.
The first one:
We asked Claude "best payroll software for fast-growing startups" a hundred times. Gusto sat at #1 in 100 of 100 responses.
Next, we asked Claude "alternatives to ADP for enterprise companies" a hundred times. Gusto's average rank across those 100 responses is 9.6.
The ICP frame moved from startup to enterprise, and Gusto dropped eight ranks with it.
Now, Claude could give each person a different response based on their context, but that’s not the point here. The point here is that the same pattern shows up across every category we tested:
- Brevo was #6 for "best email marketing platforms" and #1 for "Mailchimp alternatives."
- DocHub was #8 for "best eSignature tools" and #2 for "DocuSign alternatives."
- Workday did not appear at all in "best startup payroll software" and locked in at #1 across all 100 "ADP alternatives for enterprise" responses.
The brand that wins comparison queries is almost never the brand that wins awareness queries.
The Pearson correlation between awareness rank and comparison rank, across the 61 brands that appeared in both phases, is 0.25, close to random.
Two completely separate brand competitions are happening inside Claude, only loosely coupled, and most marketing teams are only measuring one of them.
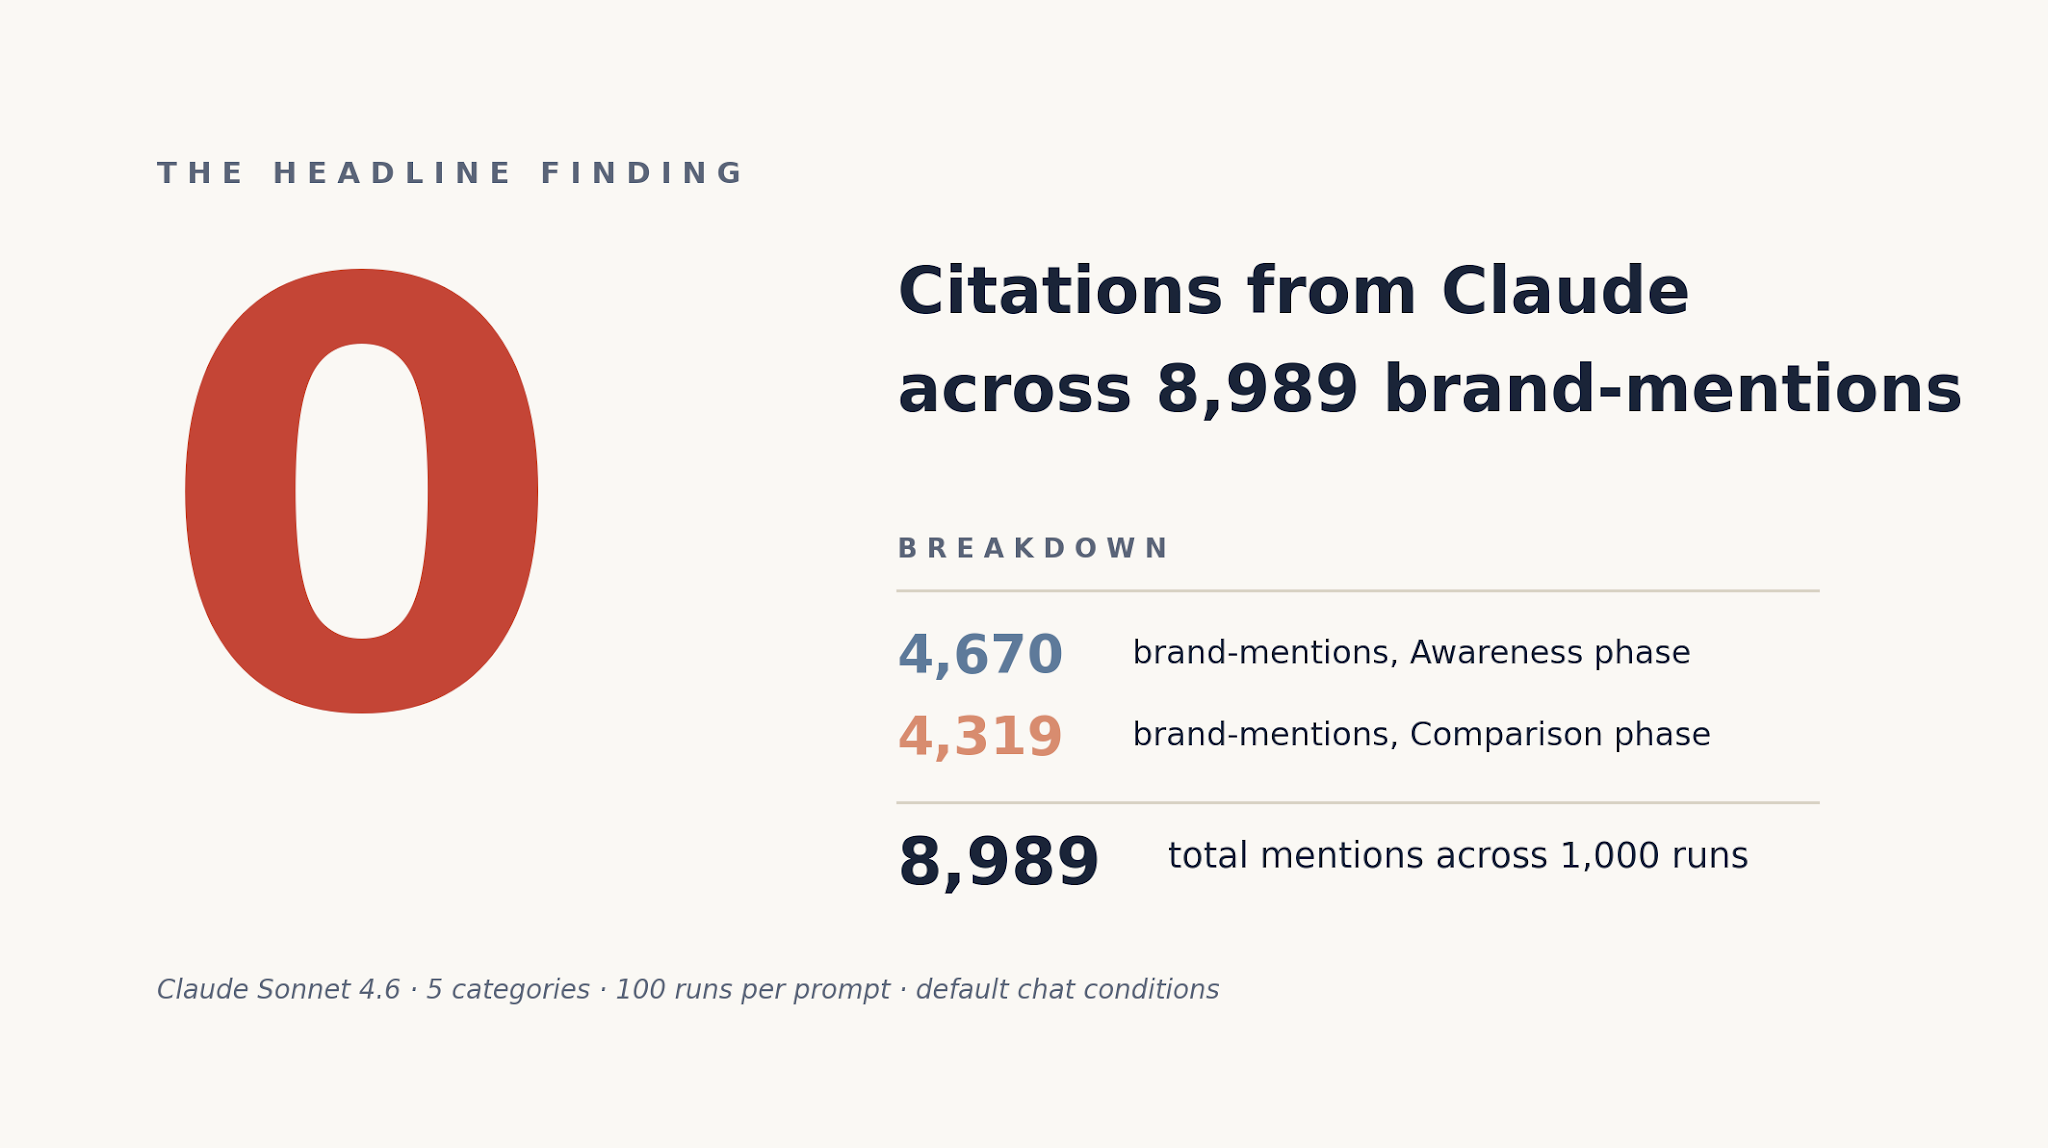
Our second big finding came from a column in our logs we expected to be busy. For every brand Claude named, we recorded any URL it offered as a source. Across all 1,000 runs and 8,989 brand-mentions, that column came back empty.
Zero citations.
The brand recommendations come entirely from the internal model.
Anthropic's own API docs note that identical inputs may produce different outputs across calls, even at temperature 0. The version of your brand inside Claude is a distribution, not a fixed answer. The buyer sees one draw from it. Your team checking "what Claude says about us" sees a different draw. Both are real.
That distribution sits between buyers and your category. G2's 2026 AI Search Report found that 51% of B2B software buyers now start their research with AI chatbots.
69% chose a vendor different from the one they originally planned. One-third bought from a vendor they had not heard of before they opened the chat.
Our study unearthed several such previously unknown facts about Claude. Lets get on to them, shall we?
Key Findings
- The same brand can be #1 for one question and absent from the next. Across 61 brands that appeared in both phases, the correlation between awareness rank and comparison rank is 0.25. That is close to random.
- The top two slots are frozen. Everything below drifts. Position #1 stays the same in 100 of 100 runs in four of five categories. By position #4, the ranking shuffles 4 to 6 places per session.
- 6.1% of awareness mentions carry Cautious framing. In comparison mode, that drops to 0%. Deel and Justworks both appear in the Payroll comparison response and lose the cautious framing they carried in 99% of their awareness mentions. The phrasing of the question alone wipes the hedging.
- Challenger brands win comparison queries decisively. Brevo climbed from #6 in awareness to #1 in comparison. DocHub from #8 to #2. Attio from a wildcard #10 to #3. The brands with "alternative to [the leader]" positioning baked into third-party content are the brands that surface when buyers actively shop for a replacement.
- Gusto drops 8.6 ranks the moment the question reframes from "startup payroll" to "enterprise ADP alternatives." Same product, different buyer context.
- Confidence Score ranges from 0.11 to 0.63 by category. A six-fold spread inside the same model on the same day. Single queries cannot tell you what Claude is going to say about your category.
- Zero citations across 1,000 runs and 8,989 brand-mentions. Page rankings, backlinks, and meta titles have no direct effect on what Claude says about your brand.
How We Ran the Study
We used Slate to bulk-run all 1,000 Claude sessions. Sending 1,000 fresh prompts by hand and copying responses out one by one would have eaten a full week of a small team. Slate ran the prompts in an afternoon, fresh session per run, no carry-over context, with logs we could parse row by row into the long-format schema.
The study setup:
- Model tested. Claude, default chat configuration, no system prompt, no memory between runs.
- Prompts. 10 total. Five awareness prompts ("what are the best [category] tools") and five comparison prompts ("alternatives to [the category leader] for [a specific buyer context]"). One of each per vertical.
- Verticals. CRM & Sales, Payroll & HR Tech, Email Marketing, eSignature, Project Management.
- Runs per prompt. 100 fresh sessions, for 1,000 total runs and 8,989 brand-mentions logged.
- Output captured. Brand mention order (rank 1 to 15+), per-brand sentiment (Positive / Neutral / Cautious), and any citation URL Claude offered. Parsing was manual, row by row.
Three terms carry through the rest of the report:
- Brand tier. Anchor brands appear in ≥80% of runs for a prompt. Floaters appear in 40 to 79%. Wildcards appear in fewer than 40%.
- Sentiment. Each brand mention tagged Positive (recommended without reservation), Neutral ("it depends on your needs" framing), or Cautious (Claude surfaces reservations on cost, compliance, or suitability without the user asking).
- Confidence Score. The fraction of 100 runs that returned the same modal 10-brand fingerprint. ≥0.5 reads as highly deterministic, 0.2 to 0.49 as moderately deterministic, below 0.2 as probabilistic.
Why Claude Picks Different Brands Each Time You Ask
How stable Claude's brand picks are depends entirely on the category. Ask "best payroll software for fast-growing startups" a hundred times in fresh sessions. In 63 of those 100 responses, the exact same ten brands come back in the exact same order. Run the same experiment for eSignature, asking "best eSignature software tools." Only 17 of 100 responses match.
That gap is what Confidence Score captures across all 10 prompts. It ranged from 0.11 in eSignature comparison runs to 0.63 in Payroll awareness runs. A six-fold spread inside the same model, on the same day, with the same study design.
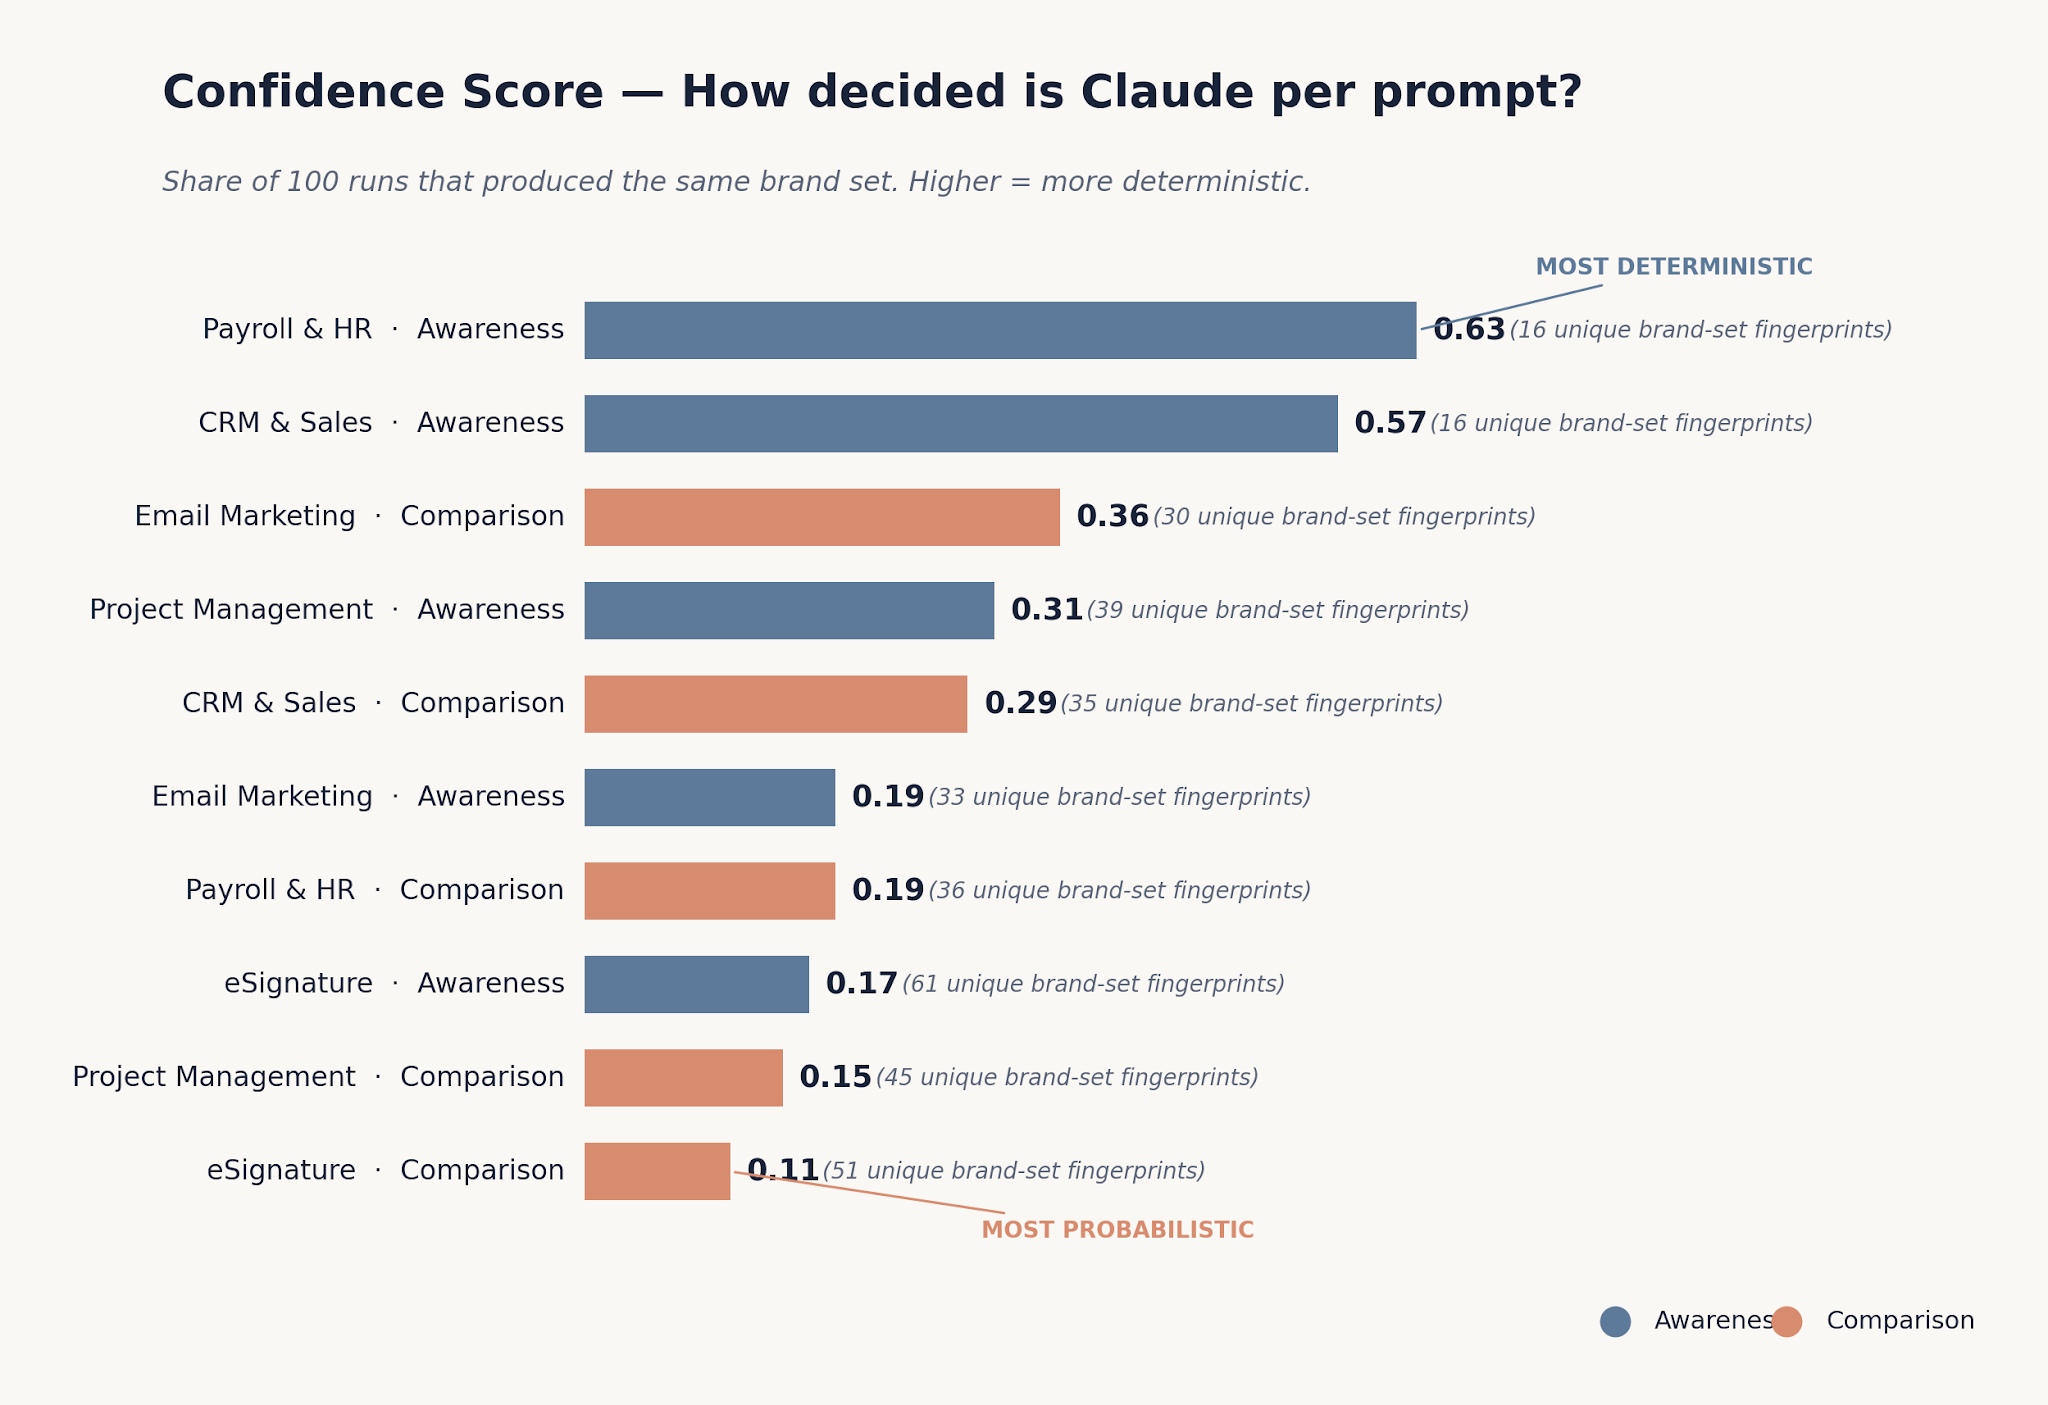
The categories where Claude is decided are categories with an uncontested leader. Payroll has Gusto, CRM has Salesforce, and in both cases the model commits to its top pick firmly. The categories where Claude is undecided either have no obvious anchor brand or sit on a question Claude has limited training signal on.
Vertical-Level Readings
Email Marketing is the lone category where the comparison phase is more decided than the awareness phase. Brevo locks at #1 in 100% of "affordable Mailchimp alternatives" runs. Claude has a clearer model of "the Mailchimp alternative" than of "the best email marketing platform."
eSignature is the most chaotic category in both phases. 0.17 dropping to 0.11. No stable brand model, high brand diversity, response-structure variation in every run. From a GEO and AI visibility standpoint, this is the biggest opportunity surface in the dataset. The space is genuinely up for grabs.
A practical takeaway for any brand checking Claude with a single query: the answer your buyer sees is one sample from a distribution that varies wildly by category. A single result in eSignature comparison is noise. Fifty results is a distribution.
Why Only the Top Two Slots Are Worth Optimizing For
If your brand sits at rank #5 in Claude's response today, the work to push it to #4 has almost no strategic value. Positions #4 and below drift 4 to 6 ranks run to run. The same brand that lands at #5 in one session lands at #9 in the next. The buyer reading the response sees a different lineup every time. Anchor status above the cliff is the only durable outcome.
Across 100 runs of each awareness prompt:
- Position #1: Zero variance in four of five categories. Frozen.
- Position #2: Holds steady 60% of the time. Average drift: 1.4 positions.
- Position #3: Only one in three brands stays put.
- Position #4 and below: Run-to-run variance jumps to 4 to 6 positions.
The strategic implication is binary. Top-two anchor status is the only rank position the buyer will reliably see. Improving from #6 to #5 changes nothing the buyer perceives. The budget question becomes: invest enough in third-party content credibility to push a brand into anchor status, or accept that its rank inside Claude is noise.
The One Category Where Even #1 Drifts
Project Management is the exception that proves the rule. Asana and Monday.com both occupy the top two slots in every run, but they trade places unpredictably. Asana averages rank 1.31 with variance of ±3. Monday.com averages 1.91 with variance of ±4. Behind them, Jira, Trello, and ClickUp shuffle between positions #3 and #12 with no consistent ordering.
When two brands of near-equal weight occupy adjacent top slots in Claude's training data, the model does not commit. The other four categories each have a single dominant anchor (Salesforce, Gusto, Mailchimp, DocuSign) that Claude treats as the uncontested category leader.
The lack of a clear rival is what makes the #1 slot frozen. Project Management is what happens when no such gap exists.
What Claude Says When Buyers Search "Best X Tools"
The awareness phase is the part most brands check first. Open Claude, type "what are the best CRM platforms," and read what the model says. It is the simplest read on where your brand sits in the model. It is also the half of the picture that most teams stop at.
Across the five awareness prompts we tested, Claude shipped:
- 39.9% Positive mentions
- 54.0% Neutral mentions (the "it depends on your needs" framing)
- 6.1% Cautious mentions
The Cautious 6.1% is the part most teams are not measuring, and it is the most actionable signal in this section. Cautious framing is the model surfacing reservations about a brand (cost concerns, regulatory risk, suitability warnings) without the user prompting for any of that.
It stays invisible in web analytics, NPS, and brand surveys. It happens silently at every point of AI-assisted research.
The Cautious Watchlist
Only three brands in the entire study received significant Cautious sentiment in awareness queries. All three sit in categories with high regulatory complexity or cost controversy.
Salesforce is the most striking pattern. It holds the #1 slot in 100% of CRM awareness runs and carries Cautious framing in 44% of those same runs. The model places it at the top and openly questions whether it is the right choice. No other category leader in any vertical carries hedged framing while still ranking at the top.
The source of cautious sentiment is the accumulated tone of compliance articles, forum discussions, G2 reviews, and analyst content that fed Claude's training data. It builds over years and changes over years.
A brand discovering Cautious sentiment in its category cannot media-buy its way out. The fix is to trace the source back to specific publications and build a 12-month narrative correction plan that addresses the underlying reservation, not the symptom.
Anchor Brands by Vertical
The full anchor list for awareness queries. Each brand below appears in 80% or more of the 100 runs for its vertical.
CRM has three additional anchors below the top six: Freshsales (#7), Copper (#8), and Nutshell (#9). All other categories taper off after #6. These are the brands Claude defaults to when no reference brand is named. In the next section, the entire landscape re-organizes.
What Changes When the Buyer Asks for "Alternatives"
Comparison queries produce a different brand landscape from awareness queries. The mechanical part is structural. The brand named in the comparison prompt sits out of its own "alternatives to" response by definition. Salesforce, Mailchimp, and DocuSign are the three named reference brands in our study, and they are mechanically absent.
The non-mechanical part is what happens to everyone else. Cautious framing vanishes from the brands that carried it. Mid-table brands climb to anchor status. The rank order across the remaining brands moves more than awareness data alone would predict.
The Sentiment Reset
The first surprise sits in sentiment. Every category in comparison mode ships near-100% Positive framing. The cautious brands from awareness (Deel, Justworks, Salesforce) either disappear from the response set or drop to the bottom of the list with their framing softened.
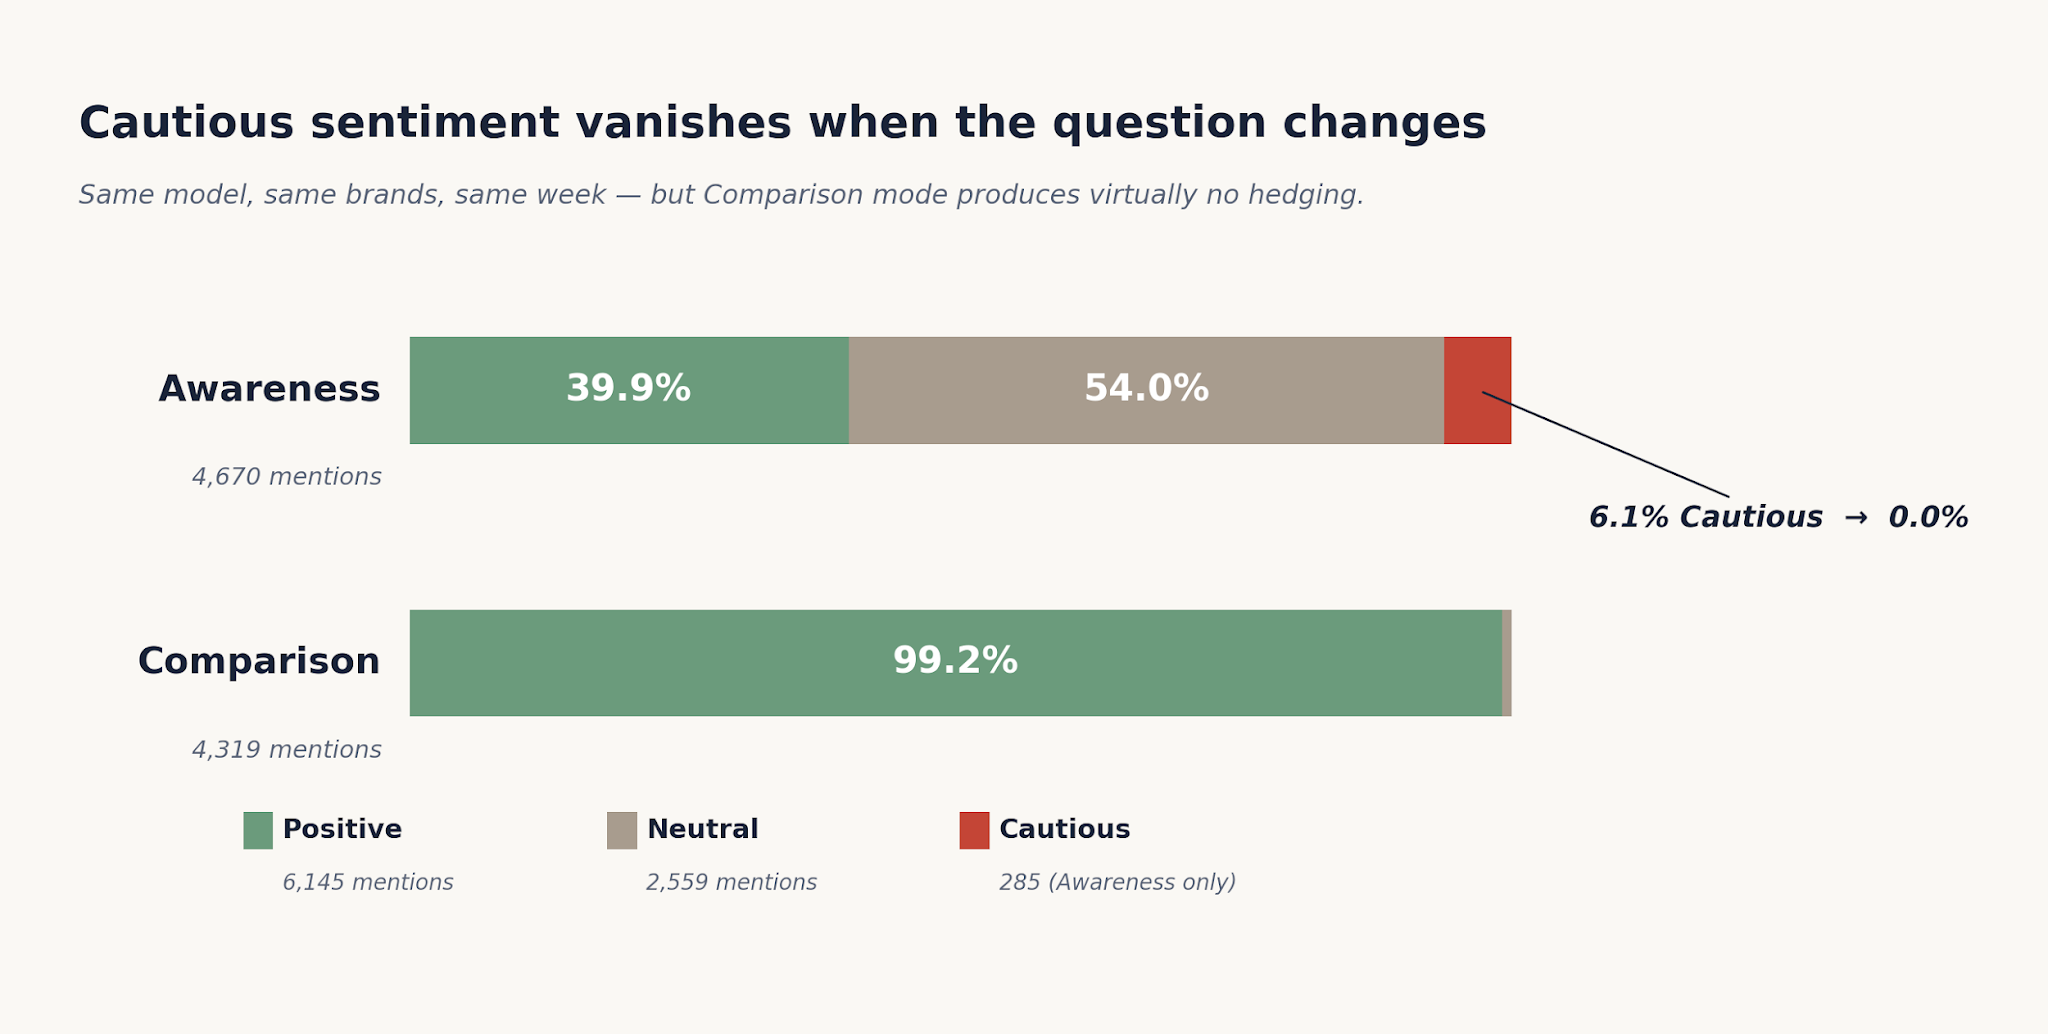
Across all 500 comparison runs, Cautious sentiment registers at 0.0%. Deel and Justworks were flagged Cautious in 99% of their awareness mentions. Both still appear in the Payroll comparison response, since we asked about ADP alternatives, not Deel or Justworks alternatives.
In both cases, the cautious framing is gone. The phrasing of the question alone wipes the hedging on the same brands, in the same week.
The Visibility-Sentiment Quadrant
Plotting every brand by appearance rate against share of Positive sentiment produces four observable patterns. The map below is from the comparison phase, where the differences are sharpest.
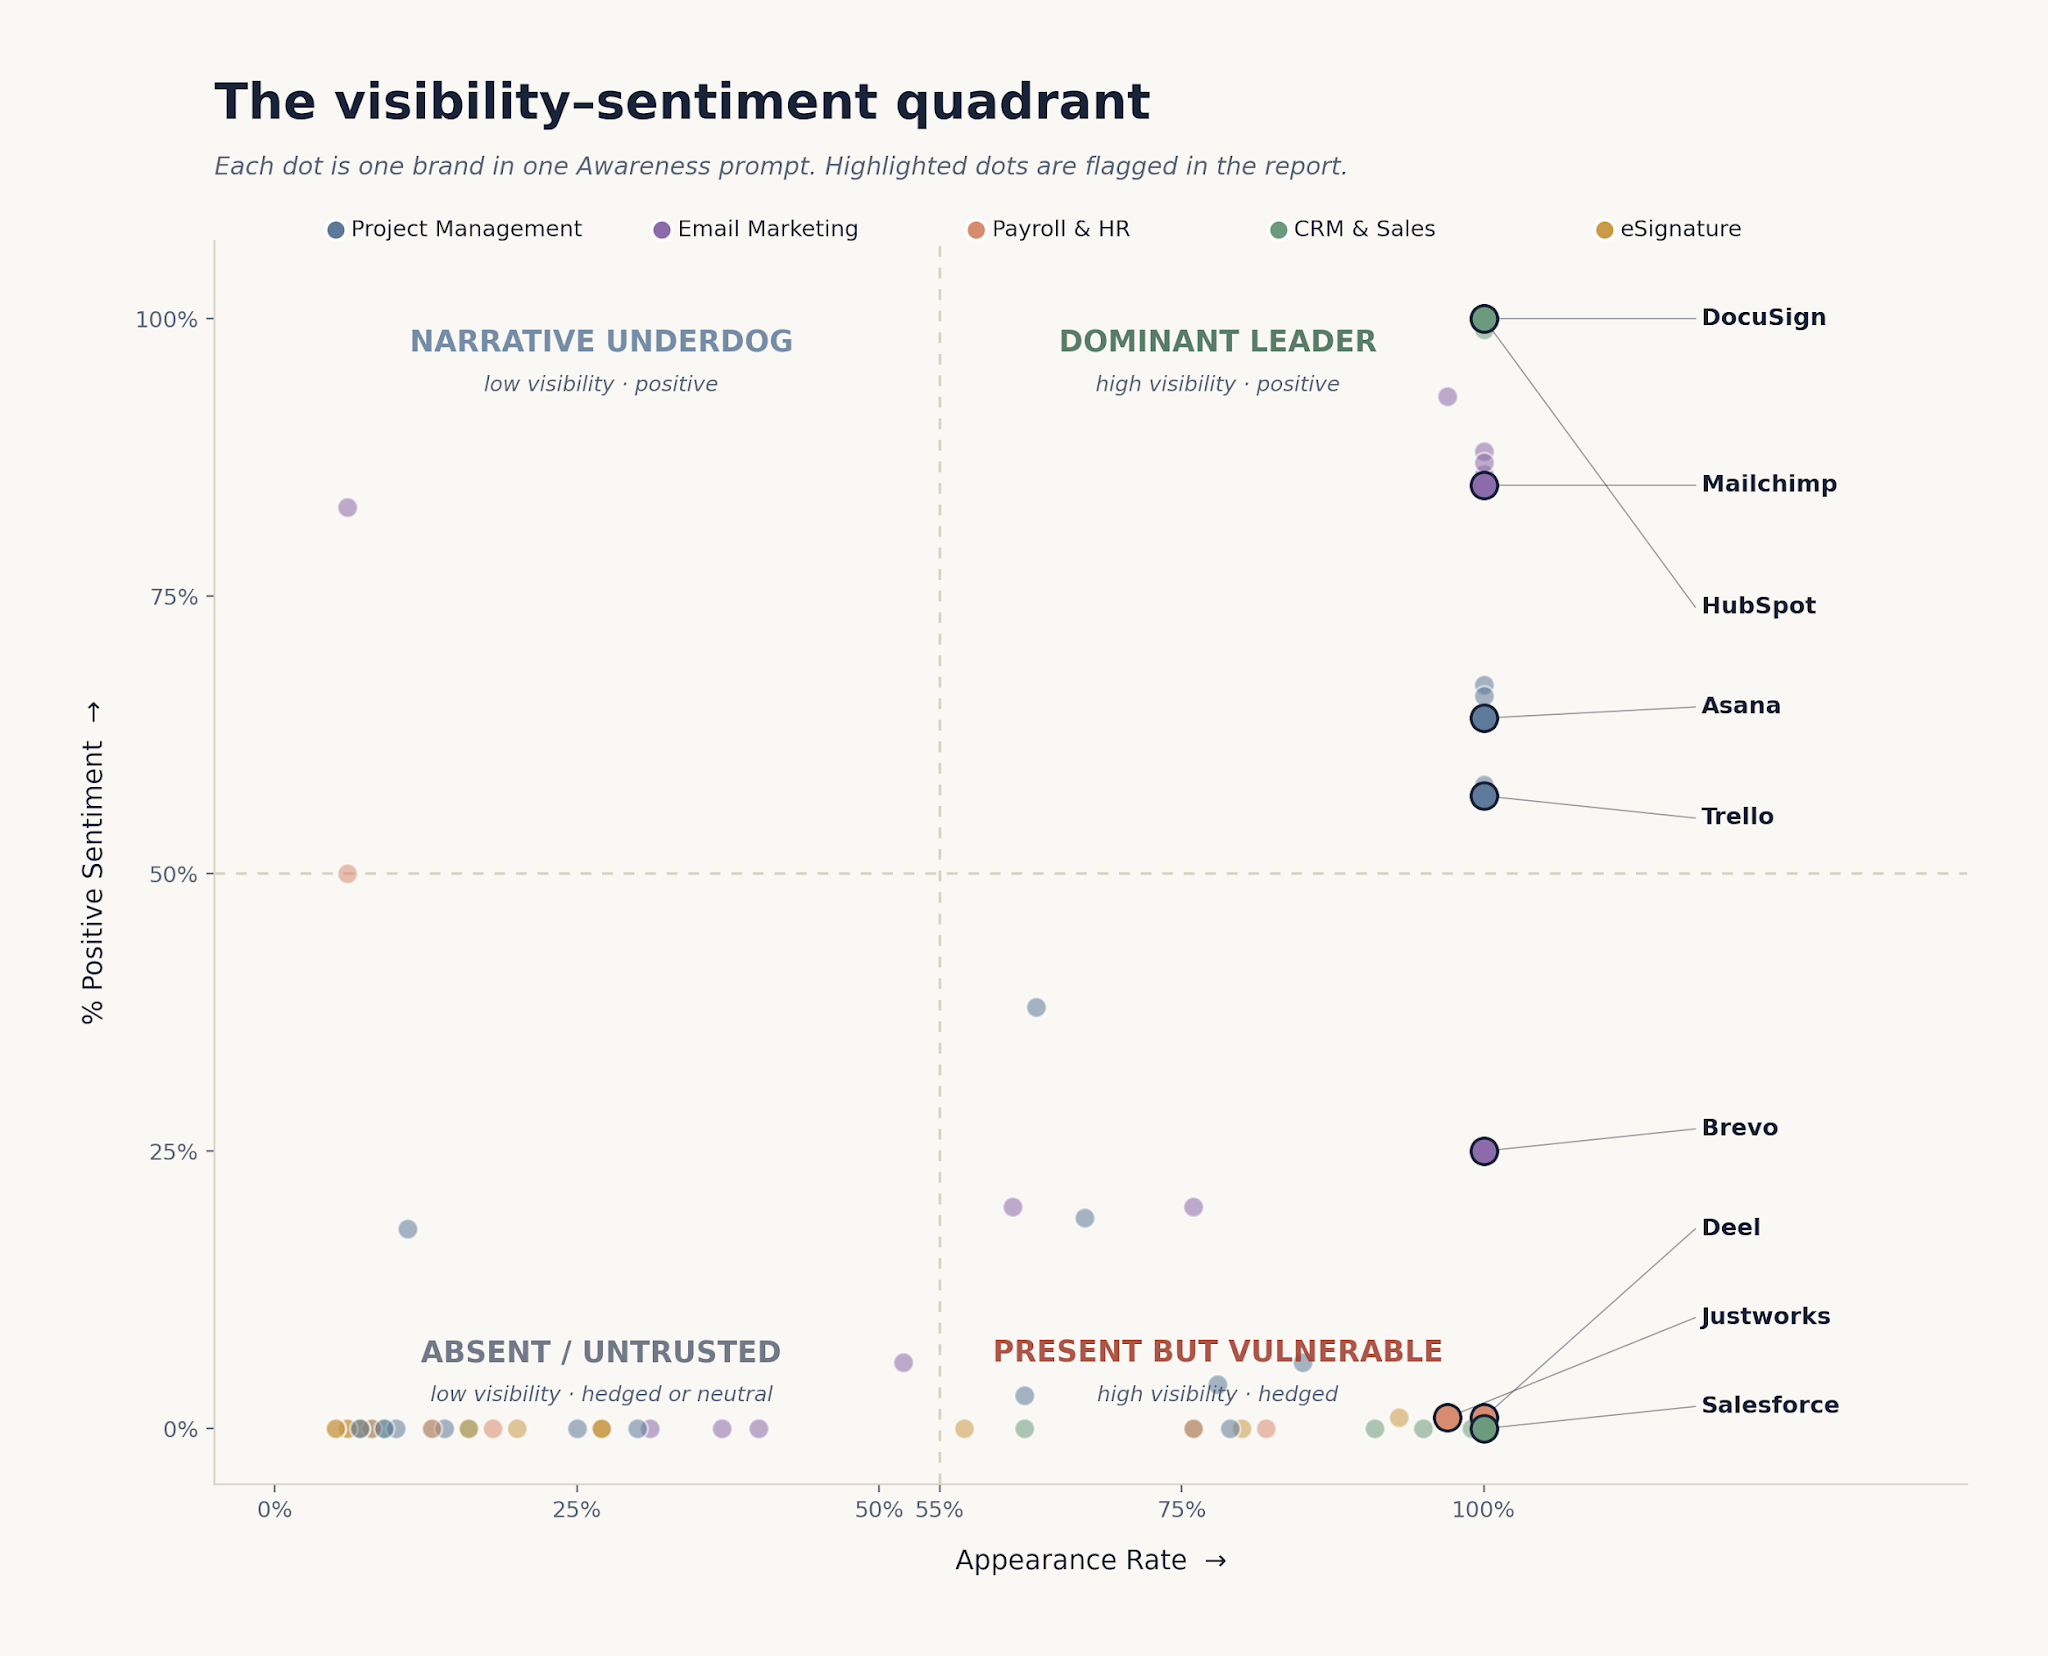
- Dominant Leaders. High visibility, high Positive. In every run, ranked high and fully endorsed. CRM: HubSpot, Pipedrive, Attio. Payroll: Workday, SAP, Oracle. Email: Brevo, ActiveCampaign, HubSpot. PM: Trello, Asana, Notion.
- Narrative Underdogs. Low visibility, high Positive. Recommended enthusiastically when they appear; they just do not appear often. CRM: Folk, Creatio, Customer.io. Payroll: Gusto, BambooHR. eSign: Docuseal, Documenso.
- Absent / Untrusted. Low visibility, neutral or hedged framing. Surfaces only in CRM, where Monday CRM, Notion, Chargebee, Mixpanel, and Segment appear as "not purpose-built as CRMs." No other vertical produces this quadrant.
- Present but Vulnerable. High visibility, hedged framing. Only appears in awareness mode: Salesforce, Deel, Justworks. This quadrant has no equivalent in comparison mode. Salesforce is excluded by the reference-brand rule; Deel and Justworks still appear in comparison but with their cautious framing dropped.
The map confirms a pattern the data has been hinting at since the first section. Comparison mode rewards positive challenger positioning and excludes the brands carrying cautious framing. The Dominant Leader quadrant in comparison is populated almost entirely by brands that ranked mid-table or absent in awareness mode.
Why Being #1 for "Best CRM" Does Not Help You for "Alternatives to Salesforce"
Brands that rank high in awareness queries do not necessarily rank high in comparison queries. The correlation between awareness rank and comparison rank, across the 61 brands that appeared in both phases, is 0.25. That is close to random.
Being #2 in "best CRM" tells you nothing about your position in "alternatives to Salesforce." These are two different brand competitions, with two different winners.
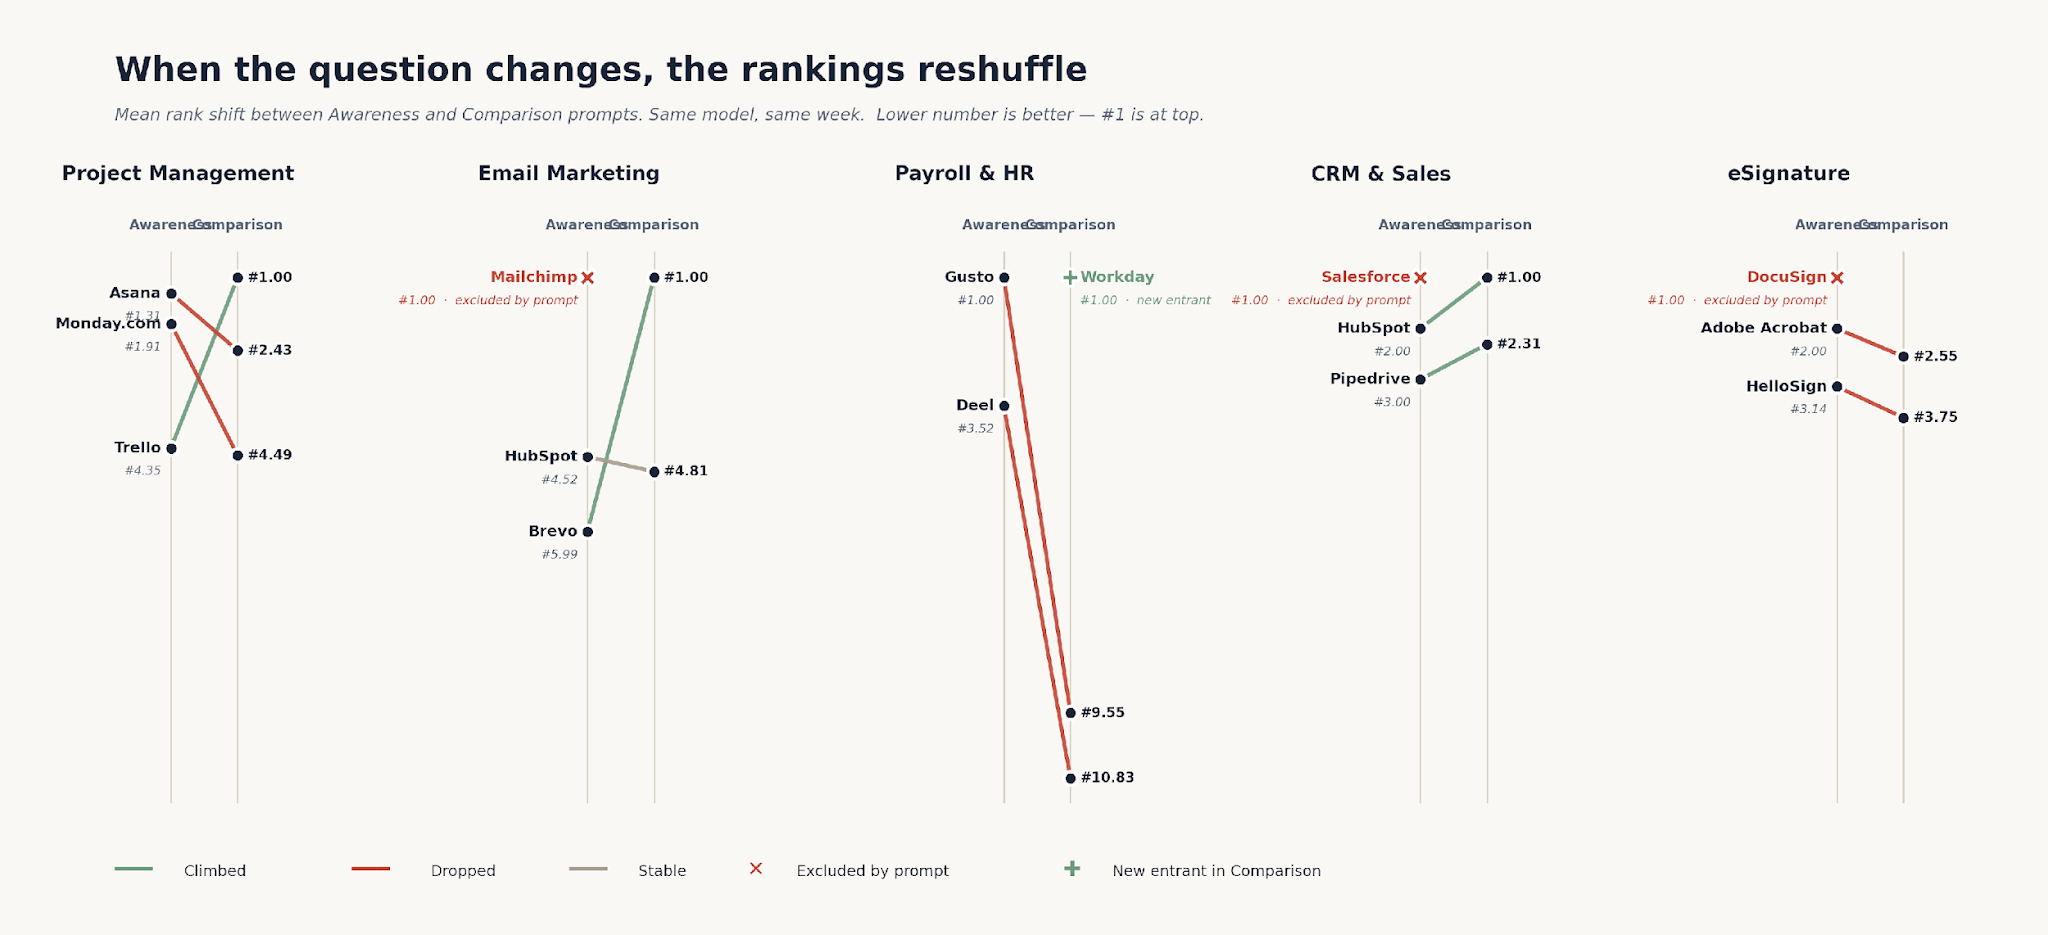
The most surprising part is that this is not a single-vertical pattern. It holds across all five categories.
What Happens to the Awareness #1 in Comparison
Three of our five comparison prompts named the category's awareness #1 as the reference brand: Salesforce in CRM, Mailchimp in Email, DocuSign in eSignature. Those three are mechanically absent from "alternatives to themselves" responses. That is a property of the prompt design, not a finding.
The interesting cases are the two awareness #1 brands we did not name in the comparison prompt. Asana for Project Management (we asked about ClickUp alternatives). Gusto for Payroll (we asked about ADP alternatives for enterprise). They behave completely differently in the comparison response.
Two awareness #1 brands sit in that table that are not the reference brand in their comparison prompt: Asana and Gusto. They behave completely differently. Asana survives the reframe with a 1.1-rank drop, staying anchored at avg #2.4. Gusto collapses 8.6 ranks to near-wildcard status.
The difference is the ICP frame. The Project Management comparison prompt asked about "ClickUp alternatives for small businesses on a budget," a context Asana fits comfortably.
The Payroll comparison prompt asked about "ADP alternatives for enterprise," a context Gusto's positioning in third-party content does not fit. The buyer context dropped Gusto eight ranks, not the reference-brand rule.
Where the Comparison #1 Came From in Awareness
The reverse map is more striking. Every single comparison #1 brand came from mid-table or absent awareness positions.
Three of the five comparison winners were nowhere near #1 in awareness: Brevo at #6, DocHub at #8, Workday missing from the response set entirely. These brands have built "alternative to [the leader]" positioning so deeply into third-party content that Claude's comparison responses now reflect it. The lever is content strategy, not product strategy.
The Brands That Win Comparison Queries (and the Ones That Collapse)
Across the 61 brands appearing in both phases, the biggest movers tell the structural story better than the averages.
The pattern behind every climber is the same. Their brand positioning in Claude's training data fits the buyer context the comparison query specifies.
"Affordable B2B Mailchimp alternative" matches Brevo, Moosend, and MailerLite because those exact phrases appear in their own content and in third-party content about them. The brands that built "alternative to" positioning years ago are the brands cashing in on it now.
The Fallers
The mechanism behind every faller is the same. The brand sits in Claude's training data as belonging to a buyer context outside the one the comparison query specifies.
Gusto's positioning in third-party content is startup payroll, but the query asks about enterprise ADP alternatives. Klaviyo's positioning is e-commerce email, but the query asks about B2B Mailchimp alternatives. The buyer context changed, not the product.
The implication for any brand selling into multiple buyer segments: the exact phrasing of an AI query is now a strategic variable. A single word change in the prompt can erase your brand. The defense is third-party content that maps your brand explicitly to each buyer context you serve.
Why Claude Never Cites a Source (and What That Means for SEO)
Across 8,989 brand-mentions in 1,000 runs, Claude returned zero working URLs. Every brand recommendation came from the internal model alone, with no source citations of any kind.
The breakdown:
- 4,670 brand-mentions in the Awareness phase, 0 citations.
- 4,319 brand-mentions in the Comparison phase, 0 citations.
- 253 unique brands surfaced across the study, 0 of them cited as URL sources.
That is structurally different from how ChatGPT, Perplexity, and Google AI Overviews behave. Those systems retrieve and cite. Claude (in the default chat configuration we tested) generates from training data alone and does not surface its sources.
The strategic implication is large. For Claude, the standard SEO levers fall away. Page rankings, backlinks, and meta titles have zero direct effect on a brand's Claude position.
The lever is the content ecosystem that fed the training data. That ecosystem includes G2 and Capterra reviews, Reddit and Quora threads, comparison blogs, analyst reports, and high-credibility content referencing your brand in the right buyer context.
This is what makes generative engine optimization different from search. The brands winning comparison queries (Brevo, Attio, DocHub) have a dense ecosystem of "alternative to X" third-party content.
That ecosystem is the lever. Building it takes 12 to 24 month content cycles and runs through credibility, not media spend.
A separate piece of Slate's AI citations research tracked six brands across ChatGPT, Perplexity, Gemini, and AI Overviews. Across those platforms, 76.3% of all AI citations went to neither the brand nor its direct competitors.
YouTube and Reddit together accounted for 86% of social citations. The pattern lines up with what we see on the Claude side: the brand's position is built outside the brand's own properties.
How to Run This Study on Your Own Category
The most useful thing in this report is not any single ranking. It is the protocol. It generalizes to any category, including yours, and a small team can run it in a week.
The setup is light. Four steps.
Step 1. Pick Two Prompts Per Query Type
One awareness prompt: "What are the best [category] tools?" One comparison prompt: "Alternatives to [your largest competitor] for [your ICP context]." Keep the phrasing natural. Match how a real buyer would type the query, not an analyst's optimized version.
Step 2. Run Each Prompt 50 to 100 Times in Fresh Sessions
Open a new Claude conversation for each run. Skip the system prompt and any prior context, and disable memory. The point is to sample the distribution, not engineer one outcome. 50 runs is enough to see the rough shape. 100 runs gets you stable Confidence Score numbers.
Step 3. Parse Into a Long-Format Schema
One row per brand-mention. Columns: run number, prompt, brand name, rank in response, sentiment (Positive / Neutral / Cautious), citation URL (almost always empty for Claude). This long format is what lets you compute appearance rate, mean rank, variance, and sentiment distribution cleanly.
Step 4. Compute Five Metrics Per Brand
For each of your top brands and your three closest competitors:
- Appearance rate. What % of runs the brand appeared in. Anchor ≥80%, Floater 40-79%, Wildcard <40%.
- Mean rank. Average position across runs where the brand appeared.
- Rank variance. The spread between best and worst position. Variance above 4 means the position is not real, just noise.
- Sentiment distribution. % Positive / % Neutral / % Cautious. Cautious is the silent reputation signal.
- Citation count. For Claude this stays at zero. For ChatGPT, Perplexity, and Gemini, this is the central variable to track.
That is enough to see your brand's distribution against your competitors' and to find the gaps that need 12 to 24 months of third-party content investment.
Running this once is diagnostic. Running it quarterly is what separates the brands building an AI visibility baseline from the brands trying to react to whatever Claude said in a single check.
What to Do With This: Plays for SEO, Marketing, and Leadership
The study has three distinct audiences with three different first moves. A head of SEO is acting on different evidence from a CMO. A CMO is acting on different evidence from a CEO. Each section below speaks directly to one.
For the Head of SEO: The Channel You Know Does Not Exist Here
The Claude channel has no URL surface. Zero citations across 1,000 runs means the standard SEO levers fall away. Page rankings, backlinks, and meta titles have zero direct effect on Claude position.
The work is in third-party content. G2's report found that 45% of buyers cite software review sites as the most confidence-inspiring signal in an AI-generated response.
G2 and Capterra reviews, Reddit threads, Quora answers, comparison blog posts, and analyst reports are the raw material Claude learned from. The brands winning comparison queries have a dense ecosystem of "alternative to X" content. Most SEO teams are not currently monitoring it.
Awareness rank and comparison rank also need separate strategies. Correlation of 0.25 means one approach does not solve both. The brands holding #1 in awareness are the brands being replaced in comparison. These need separate content briefs, separate third-party presence, and separate performance targets.
First action. Run the protocol on your own category. Audit your brand's presence in "alternatives to [competitor]" content across G2, Reddit, and the top comparison blogs in your space. That is where your comparison rank is built.
For the CMO: Your Brand Has Two AI Identities
What Claude says about you in "best X tools" queries is almost uncorrelated with what it says in "alternatives to Y" queries. You have two brand narratives running inside AI, and most marketing teams are managing one of them.
Being the awareness #1 carries an asymmetric risk. The natural search at the decision moment is "alternatives to [your brand]." Your brand is mechanically absent from that response set. Your competitors are the entire conversation.
Salesforce, Mailchimp, and DocuSign all sit in this position. Owning awareness for a category in B2B SaaS means owning the brand buyers most naturally search alternatives to.
Cautious sentiment is invisible reputation risk. Deel and Justworks appear in 99-100% of payroll awareness runs with 99% Cautious framing. This pattern stays invisible in NPS, brand surveys, and web analytics.
It happens silently at every point of AI-assisted research. The source traces back to the accumulated tone of reviews, compliance articles, and forum discussions that fed the training data.
Challenger positioning is where comparison rank is won. Brevo was #6 in email awareness and #1 in comparison. DocHub was #8 in eSignature awareness and #2 in comparison. The pattern: brands with deeply embedded "alternative to [the leader]" positioning in third-party content win comparison. This is a content strategy choice, not a product feature.
First action. Commission the protocol for your category. Score the framing per brand. If you find Cautious sentiment on your own brand, trace it to its source in third-party content and build a 12-month narrative correction plan.
For the CEO: A New Share-of-Voice Metric
Your brand has a Claude position you have been building for years without knowing it. Half of B2B software buyers now start research with AI chatbots.
That conversation is what shortlists you in or out before sales ever sees the deal.
Category leadership and decision-moment presence are two separate competitions. Salesforce is the awareness #1 in CRM with zero variance. The natural buyer search at the decision moment is "alternatives to Salesforce," a response built around finding its replacement, with HubSpot, Pipedrive, and Attio at the top.
Owning awareness does not protect you at the decision moment. For dominant category leaders, it actively defines them out of it.
A single word change in the query can erase your brand. Gusto is the #1 payroll brand in startup queries. The moment framing changes to enterprise ADP alternatives, Gusto drops to #9.6. The buyer context changed, not the product. The phrasing of AI queries is a strategic variable, not a downstream consequence.
This cannot be fixed with media spend. Claude has no ad inventory and no sponsored placements. AI brand position is built through the accumulated quality and tone of everything written about your company in training data. It changes slowly, over 12 to 24 month content cycles. Positioning discipline moves this. Budget does not.
First action:
Add AI Share of Voice to quarterly KPIs alongside search SOV. Run the protocol for your top three competitors every quarter. The companies starting in 2026 will have the baseline advantage as this measurement becomes standard practice.
Conclusion
The single most actionable finding lives in the variance. Confidence Score ranges from 0.11 to 0.63 across the 10 prompts we ran.
Single queries to Claude return one draw from a distribution that varies six-fold by category and inverts almost entirely between awareness and comparison phrasing. Checking your brand with one query is the wrong instrument for measuring something that behaves as a distribution.
The structural model under the data is two separate brand competitions, only loosely coupled. Awareness rewards uncontested category leadership. Comparison rewards challenger positioning embedded in "alternative to" content. The correlation between the two is 0.25, effectively noise. Most teams are managing one of them.
The zero-citation finding closes off the obvious fix. Claude has no URL surface to optimize against. The lever is the third-party content ecosystem (G2, Reddit, comparison blogs, analyst reports, forum threads). The only way to move it is through 12 to 24 month positioning work, not media spend.
We built Slate to run this protocol continuously across customer portfolios. The platform tracks brand presence and sentiment across Claude, ChatGPT, Perplexity, Gemini, Google AI Overviews, AI Mode, Copilot, Grok, Meta AI, and DeepSeek.
It runs the awareness and comparison prompts on a schedule, surfaces the distributions, and flags when Cautious sentiment appears or when a competitor's third-party content ecosystem moves.
If you want a wider map of the AI search landscape first, our coverage of GEO platforms is a useful starting point.
When you are ready to see this study run live against your own brand and your three closest competitors, book a demo with Slate. We will plug your data in and walk you through the distribution.
Frequently Asked Questions
What was tested in this Claude brand ranking study?
We ran 10 prompts across five B2B SaaS verticals: CRM & Sales, Payroll & HR Tech, Email Marketing, eSignature, and Project Management. Each prompt ran 100 times in a fresh Claude session.
Five awareness prompts ("best [category] tools") and five comparison prompts ("alternatives to [the leader]"). 1,000 total runs, 8,989 brand-mentions, 253 unique brands.
What does Confidence Score measure?
Confidence Score is the fraction of 100 runs that returned the same 10-brand fingerprint for a given prompt. A score of 1.0 means every run was identical. A score of 0.0 means complete randomness. Above 0.5 reads as highly deterministic, 0.2 to 0.49 as moderately deterministic, below 0.2 as probabilistic.
Why did Claude return zero citations across 1,000 runs?
In the default chat configuration tested, Claude generates brand recommendations from its internal training data instead of retrieving and citing sources.
ChatGPT, Perplexity, and Google AI Overviews retrieve and cite. Claude does not surface URL sources in default chat. GEO for Claude works through the third-party content ecosystem that fed training data, not through on-page SEO.
How does an "alternatives to X" query change which brands appear?
Three things change. First, the named reference brand in the prompt is mechanically absent. Salesforce cannot appear in "alternatives to Salesforce."
Second, the cautious framing that flagged Deel and Justworks in 99% of their awareness mentions vanishes when they appear in the Payroll comparison response. Third, brands with deeply embedded "alternative to [the leader]" positioning climb 5 to 7 positions. Brevo, DocHub, Attio, and Moosend all moved this way.
Why does Gusto drop 8.6 positions between awareness and comparison?
The awareness prompt for Payroll asked about startup payroll software, where Gusto is the uncontested #1. The comparison prompt asked about "enterprise ADP alternatives," which is outside Gusto's startup ICP. The buyer context changed, not the product. Brand positioning that anchors to one segment collapses when the query reframes to a different segment.
How do I run this protocol on my own category?
Pick two prompts: one awareness ("best [category] tools"), one comparison ("alternatives to [your largest competitor] for [your ICP context]"). Run each 50 to 100 times in fresh Claude sessions.
Parse into a long-format schema (one row per brand-mention, with rank and sentiment). Compute appearance rate, mean rank, rank variance, and sentiment distribution per brand against your three closest competitors. A small team can complete this in a week.
Does this generalize beyond B2B SaaS?
The methodology generalizes. The specific numbers (0.25 correlation, the rank cliff at #3, the sentiment reset in comparison mode) are calibrated to the five B2B SaaS verticals tested. E-commerce, consumer brands, and professional services each have their own brand distribution shape in Claude. The protocol transfers. The benchmarks do not.
What is the single most useful thing to do with this study this quarter?
Run the protocol on your own category for your brand and your three closest competitors, awareness and comparison both. The output tells you four things in one pass:
- Where Claude positions you in each query type.
- Where Cautious sentiment is hiding.
- Which competitors have the strongest "alternative to" content ecosystem.
- Which buyer contexts are absent from your third-party presence.
That is enough to redirect a content roadmap.