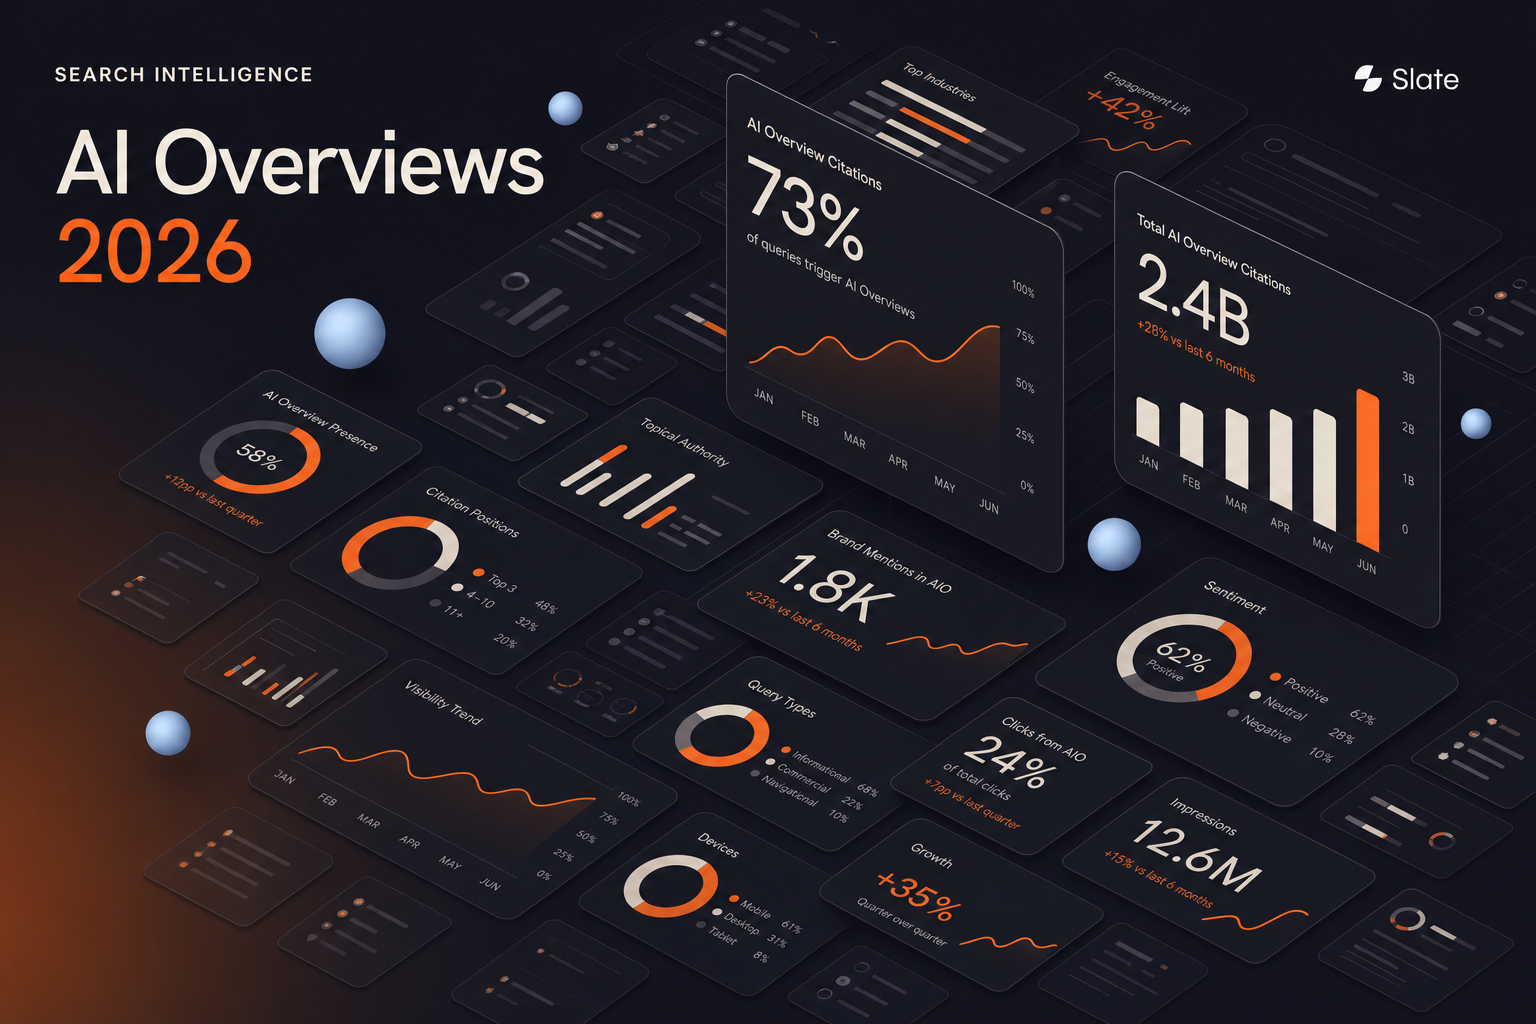
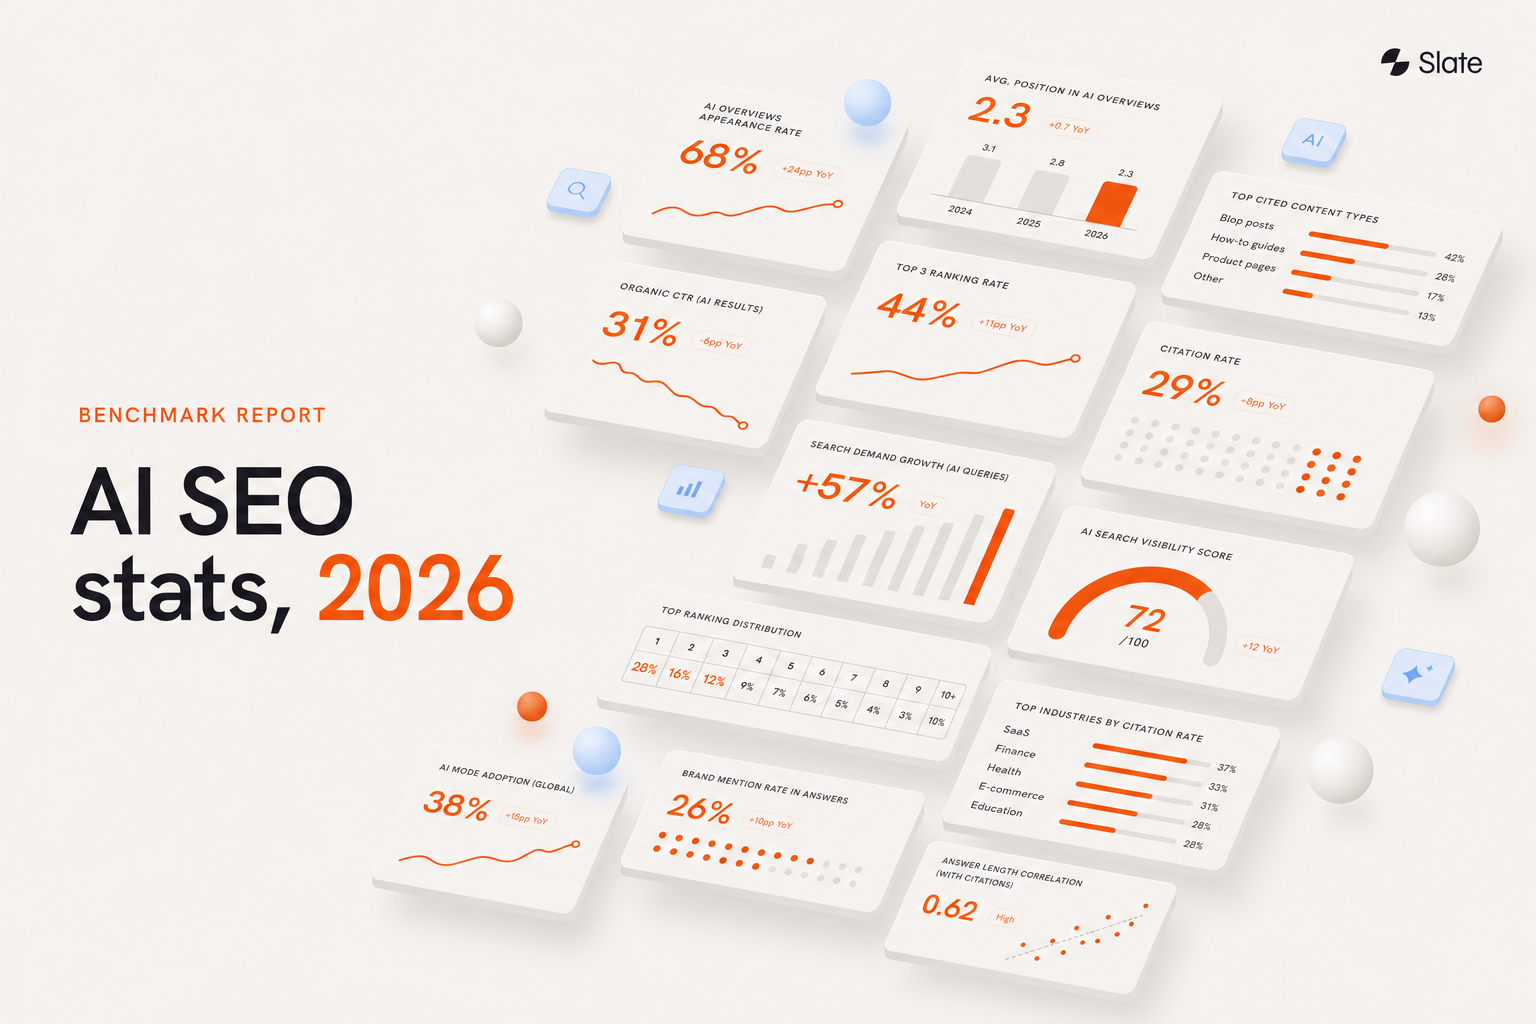
AI Overviews went from an experiment to a default part of Google Search faster than most teams updated their reporting. This roundup gathers verified 2025 to 2026 statistics on AI Overview prevalence, CTR impact, zero-click behavior, and citation patterns, then translates each number into what it means for SEO and content teams.
Across major 2025 to 2026 studies, AI Overviews appear on roughly 15% to 25% of all Google searches in conservative mixed-intent datasets and up to 48% to 50% in industry-specific or informational-heavy panels. Prevalence runs highest on informational and question-based queries, organic CTR often drops 34% to 61% when an AI Overview appears, and citation overlap with the organic top 10 has weakened sharply year over year.
Key Takeaways
- AI Overviews appear on roughly 15% to 25% of queries in conservative mixed-intent datasets and up to 48% to 50% in informational-heavy panels. Prevalence depends entirely on the query set, so never quote one number without context.
- About 88% to 91% of AI Overview queries are informational, so your most explanatory content sits in the highest-exposure zone.
- Organic CTR drops roughly 34% to 61% when an AI Overview appears, with position 1 clicks down around 58% in some datasets. Rank alone no longer predicts traffic.
- Some 2026 datasets report 60% to 83% of AI Overview searches ending without a click, making zero-click the default outcome on many informational queries.
- Citation overlap with the organic top 10 fell from roughly 76% in mid-2025 to between 17% and 54% in early 2026, so citation presence is a separate visibility layer from ranking.
- Sites cited inside the AI Overview can see better CTR than uncited results on the same SERP, with studies reporting an organic-CTR lift of roughly 35%
- AI Overviews appear on roughly 47% of informational queries in Europe as of March 2026, with projections above 60% by year end, so exposure is still expanding.
- B2B SaaS blog, glossary, and comparison pages typically sit in the highest-exposure zone, while pricing and navigational pages are more insulated, so map page types before you panic.
A Quick Note on How We Sourced These Statistics
Every figure here is attributed to a named source and dated, because in AI search reporting the method behind a number counts as much as the number itself. The data draws on large-scale SERP panels (Conductor's 21.9 million query dataset, Ahrefs, Sistrix, BrightEdge), independent SEO studies (Seer Interactive, SeoProfy, Stacc, Safari Digital), user-behavior panels, and Google's own disclosures. The comparison window runs January 2025 through April 2026.
One distinction shapes everything that follows. Google AI Overviews are the AI-generated summaries that appear inside standard search results. AI Mode is a separate, opt-in conversational surface with its own metrics: roughly 100 million plus monthly active users versus the 2 billion monthly users Google attributes to AI Overviews. Broader AI search behavior across ChatGPT, Perplexity, and Gemini is different again. Mixing these surfaces is the most common reason two AI search studies look incompatible.
Confidence note: directional findings (growth in prevalence, CTR pressure on informational queries, weakening citation-rank overlap) are high-confidence and consistent across studies. Exact prevalence percentages are disputed and depend heavily on sampling, so treat ranges as more reliable than any single headline figure.
Google AI Overviews Usage and Prevalence Statistics (2026)
AI Overview prevalence in 2026 varies widely by study because datasets differ by country, device, query set, and method. The takeaway is directional: AI Overviews appear most often on informational and question-led searches, and their footprint has grown year over year. Conservative mixed-intent panels land near 15% to 25%, while informational-heavy panels frequently report 48% to 50% or higher.
Here's how the major studies break down, with the context behind each figure.
Conductor (21.9 million queries, multi-market, mixed intent, 2025 to Jan 2026): AI Overviews appeared on 25.11% of queries overall across a 21.9 million query dataset analyzed September 15 to October 12, 2025. What it means: on a large, mixed panel that includes branded and non-branded queries across desktop and mobile, roughly a quarter of searches now carry an AI Overview. Why it counts: this is one of the most defensible all-queries baselines available.
SeoProfy (mixed intent, through Nov 2025): Reports prevalence peaking near 25% in mid-2025, then settling around 15.69% by November 2025, with 88% to 91% of those AIO queries being informational. What it means: prevalence isn't a straight climb; it fluctuates as Google tunes the feature. Why it counts: a 2025-only snapshot understates where things sat by early 2026.
BrightEdge (9-industry tracker, US, 2026): Roughly 48% prevalence across nine tracked industries in March 2026. What it means: industry panels skewed toward commercial and informational research show far higher coverage than all-query baselines. Why it counts: your category may sit well above or below the 25% average.
Safari Digital (conservative, non-branded mix, 2026): Safari Digital (conservative, non-branded mix): Roughly 21% prevalence in a conservative non-branded panel.
Stacc (mixed panel, April 2026): AI Overviews appear on 48% of all search queries, up 58% year over year. What it means: a strong informational bias in the panel pushes the rate toward the high end. Why it counts: the year-over-year growth signal is more reliable than the absolute number.
AISOS (Europe, informational queries, March 2026): AI Overviews on 47% of informational queries in Europe. What it means: the European rollout lagged the US but is catching up fast. Why it counts: geography is a major variable in any prevalence claim.
DigitalApplied (pure informational set, 2026): 99.9% of informational keywords show AI Overviews. What it means: on a strictly informational keyword set, AIO presence is near-universal. Why it counts: this is an upper bound, not an all-queries figure, so frame it that way.
Source | Metric | Market / device | Timeframe | Finding | Notes |
| Conductor | All queries | Multi-market, desktop + mobile | Sep–Oct 2025 | 25.11% (peak 47%) | 21.9M-query panel, mixed intent |
| SeoProfy | All queries | Mixed | Through Nov 2025 | 15.69% (peak \~25%) | 88% to 91% informational |
| BrightEdge | 9 industries | US | Mar 2026 | \~48% | Commercial/informational skew |
| Safari Digital | Non-branded | Mixed | 2026 | \~21% (60% to 65% long-tail) | Conservative panel |
| Stacc | All queries | Mixed | Apr 2026 | 48% (+58% YoY) | Informational bias |
| AISOS | Informational | Europe | Mar 2026 | 47% | EU-only |
| DigitalApplied | Informational only | Global/US | 2026 | 99.9% | Curated informational set |
What this means for marketing teams: pick a baseline that matches your own query mix. If most of your traffic comes from informational content, plan against the higher coverage figures, not the 25% average. For broader context on tracking exposure, see Slate's roundup of Google AI Overviews statistics 2026 tooling and AI Overview usage statistics 2026 resources.
Why AI Overview Statistics Vary So Much Between Studies
AI Overview statistics often conflict because publishers measure different query sets, devices, markets, dates, and surfaces. Some studies track only Google Search, while others mix in AI Mode, mobile behavior, or broader AI traffic. Always check what each study counted before comparing numbers.
This is the gap most stats roundups leave open. They list a 15% figure next to a 50% figure with no explanation, leaving readers to assume someone's wrong. Usually both are right. The divergence comes from a handful of predictable variables:
- Query sampling: informational, long-tail, or non-branded sets produce far higher rates than mixed panels that include navigational searches.
- Geography: US rollout led Europe by months, so US and EU figures from the same period rarely match.
- Device mix: mobile-heavy datasets can look different because Google has tested AI Overviews more aggressively on mobile.
- Search surface: some AI search numbers quietly fold in AI Mode usage or other AI SERP features alongside AI Overviews.
- Date drift: prevalence has moved up, down, and up again; a mid-2025 snapshot and an April 2026 snapshot describe different realities.
Three concrete pairs show this in action. Conductor's 25.11% (Sep–Oct 2025) sits against SeoProfy's 15.69% (through November 2025), largely a timeframe and panel difference. Stacc's 48% sits against Safari Digital's 21%, an informational-skewed panel versus a conservative non-branded one. DigitalApplied's 99.9% sits against AISOS's 47% for informational queries, a curated global set versus a broader EU-classified one.
Confidence note: trust the direction (growth, informational skew, CTR pressure) far more than any single exact percentage. When you cite a number in a deck, name its source, date, and query type in the same breath.
AI Overviews CTR and Click-Through Rate Statistics
Multiple studies report lower organic click-through rates when AI Overviews appear. The size of the drop varies by query type, device, and whether a brand is cited inside the answer, so compare studies carefully instead of trusting a single number.
The headline pattern holds even when the exact figures differ.
Seer Interactive (early studies): Organic CTR for AIO queries fell from 1.76% to 0.61%, a 61% drop, before partially rebounding by April 2026 while staying well below AIO-absent baselines. What it means: when the answer's on the page, fewer people click, and the floor sits much lower than classic SERPs. See Seer Interactive's AI Overview CTR study for the full picture.
Ahrefs-based analyses (2025): Position 1 CTR declines roughly 58% when an AI Overview is present, with the decline worsening across 2025. What it means: even the top organic spot loses more than half its clicks on affected queries. The Ahrefs analysis of position 1 CTR decline details the methodology.
AISOS / Sistrix (EU, March 2026): Sistrix (Germany, February 2026): position 1 organic CTR falls from 27% to 11% (about a 60% drop) when an AI Overview is present; the aggregate loss is about 6.6% of clicks across all keywords (roughly 265 million organic clicks per month in Germany). What it means: lower positions absorb the steepest losses, and the SERP as a whole leaks clicks. The Sistrix research on AI Overview CTR by position breaks down the positional detail.
Pew-style user panel: Users click a traditional result in only 8% of visits when an AI summary is present, versus 15% without it. What it means: the presence of a summary nearly halves the chance of any outbound click. The Pew Research data on AI summary click behavior documents this shift.
Stacc (2026 synthesis): A 34% to 61% organic CTR drop range across studies, depending on query cluster. What it means: the honest answer to how much CTR will fall is a range, not a point estimate.
Study | Query set | Reported change | Caveat |
| Seer Interactive | AIO queries | CTR down 61% Q3–Q4 2025 (impression-driven; clicks roughly flat) | Partial rebound by Apr 2026 |
| Ahrefs | Position 1 | \~down 58% | Worsened across 2025 |
| AISOS / Sistrix | Positions 1 to 3 / 4 to 10 | down 18% / down 35% | EU, informational focus |
| Pew-style panel | With vs without summary | 15% to 8% click rate | User behavior panel |
| Stacc | Mixed | down 34% to down 61% | Varies by query cluster |
One nuance changes the picture: cited brands behave differently from uncited results. AISOS / Sistrix found 22% higher CTR for sites whose link appears inside the AI Overview versus a classic position 1 result, plus a 340% lift in impressions for cited versus non-cited sites on the same query. Other syntheses report cited brands earning roughly 35% more clicks than uncited ones.
What this means for marketing teams: separate position 1 CTR loss from overall SERP CTR loss, and treat citation status as its own performance driver. A page that loses its position 1 click rate but starts getting cited may come out net-protected. Benchmark your affected queries against Slate's Google AI Overviews CTR drop statistics work and the broader Google AI Overviews CTR drop statistics 2025 to 2026 analysis.
Zero-Click and Organic Traffic Impact Statistics
Research consistently links AI Overviews with higher zero-click behavior. When Google answers more of the query on the results page itself, fewer users click through to websites. The effect is strongest on informational queries where the answer is fully resolved on the SERP.
The figures vary by panel but point the same way.
Stacc (2026): Around 60% of searches end without a click, framed as the new default for most informational queries. What it means: zero-click is now the median outcome on informational SERPs.
Arvow (2026 synthesis): 83% of AI Overview searches end in zero clicks. What it means: on AIO-present queries specifically, the no-click share climbs even higher than the all-search baseline.
Pew-style panel: Users ended their session after a search with an AI summary 26% of the time, versus 16% without one. What it means: beyond absorbing the click, AI summaries end the whole session more often. The Pew panel on session-ending behavior with AI summaries reports the 26% versus 16% split.
AISOS / Sistrix (EU): Down 25% total clicks to third-party sites on SERPs with an AI Overview. What it means: even when some clicks survive, total outbound volume drops a lot.
Now the practical question competitors skip: how do you tell whether your traffic loss came from AI Overviews or from a normal ranking decline? There's no single standard framework, but expert guidance converges on a diagnostic sequence:
- Track, for each keyword, whether an AI Overview is present, absent, or intermittent by week.
- Overlay AIO presence with CTR and click trends. Where rank holds steady but clicks fall after an AIO appears, attribute the loss to AIO suppression.
- Build a control cohort of similar queries without an AIO to estimate the normal CTR change from rank moves alone.
- Compare cited versus non-cited URLs. If your cited page holds up while non-cited competitors collapse, the AI layer is doing the work.
- Segment by intent, since informational full-answer Overviews are the most likely to suppress clicks.
What this means for marketing teams: traffic loss is now a visibility-measurement problem as much as a ranking one. Add AIO presence and citation status columns to your keyword reports before you assume a drop is algorithmic. Slate's resources on AI Overviews impact on organic traffic, AI Overviews traffic loss statistics, and Google AI Overviews traffic impact statistics go deeper on measurement.
Where Do Google AI Overviews Get Their Citations?
AI Overview citations come from both organically ranking pages and pages that don't rank in the top traditional positions. That makes citation visibility a separate measurement problem from classic keyword ranking.
The overlap data tells the story. Ahrefs-based research found that in mid-2025, roughly 76% of AI Overview citations came from pages already ranking in the organic top 10. By early 2026 that overlap had fallen to roughly 38% (Ahrefs), meaning about 62% of citations came from outside the classic top 10.
Are AI Overview citations the same as organic rankings? Not always. Studies point to a widening gap between cited pages and top-ranking organic results. A page can appear inside the AI answer even when it isn't the highest-ranking traditional result for that query, and as of early 2026 that mismatch is common across many query sets.
Finding | What it suggests | Content action for teams |
| Citation-rank overlap fell from \~76% (mid-2025) to 17% to 54% (early 2026) | Top rankings no longer guarantee citation | Track citation presence as a separate KPI |
| Up to 46% to 83% of citations from outside top 10 | Deep, specific pages get cited | Build extractable answers across the topic, not just hub pages |
| Cited sites gain roughly 35% higher organic CTR than uncited results | Citation drives performance | Engineer content for citation readiness, not just rank |
This is where citation readiness becomes something teams engineer instead of observe. If a page outside the top 10 can earn a citation, the deciding factor is often how cleanly the content answers a specific sub-question with clear definitions and structured comparisons an AI system can lift directly. The architecture goal moves from ranking one page at position 1 to being the clearest extractable answer across an entire topic surface. For more on the citation layer, see Slate's work on AI Overview citation and usage statistics.
Which Query Types and Industries Trigger AI Overviews Most Often?
AI Overviews are most common on informational, question-based, and longer-tail searches. They appear less often on navigational queries and vary more on transactional or shopping searches depending on the dataset and SERP context.
Query type | Likelihood of AIO presence | Common SERP behavior | SEO implication |
| Informational / question | High (47% to 99% depending on set) | Answer often fully resolved | Highest CTR and zero-click risk |
| Long-tail (10+ words) | High (\~53%) | Detailed synthesized answer | Strong citation opportunity |
| Navigational / branded | Low | Classic results, knowledge panels | Largely insulated |
| Transactional / shopping | Variable | AIO often below shopping/local units | Inconsistent; monitor closely |
Informational vs Navigational vs Transactional Patterns
Informational and question-led queries carry the steepest exposure because the AI answer frequently resolves the need on the page. Navigational and branded searches rarely trigger an AI Overview at all. Transactional and strongly localized queries fall in between, where Google sometimes omits the AIO or pushes it beneath shopping and local units, which makes the effect inconsistent across datasets.
Branded vs Non-Branded AI Overview Behavior
Branded and navigational queries are much less likely to trigger AI Overviews than non-branded informational ones. Safari Digital's conservative panel was explicitly non-branded, and industry commentary treats AI Overviews as a mainly non-branded, informational phenomenon. A clean numeric branded-versus-non-branded split isn't published in the open literature yet, so take it as directional, with no precise number behind it so far.
Mobile vs Desktop Differences
AI Overviews skew mobile. One 2026 stats roundup reports that roughly 81% of searches triggering an AI Overview happen on mobile, and the visual impact is larger there because the answer takes up more of the above-the-fold viewport, pushing organic links further down. Hard comparative CTR splits by device aren't well documented yet, so the larger mobile effect is best stated qualitatively.
How AI Overviews Affect B2B SaaS Content Programs (Slate's Lens)
Most stats roundups stop at the all-industry averages. For B2B SaaS teams, the more useful question is which page types sit in the blast radius and which are insulated. The general informational-trigger behavior maps cleanly onto common SaaS content structures, even though no open dataset publishes a precise SaaS-specific prevalence figure yet. For a deeper look at the tooling landscape, Slate's roundup of the best AI SEO tools for B2B SaaS teams maps the options.
Here's the directional exposure by page type, based on observed informational-trigger patterns:
- Blog and informational content: highest exposure. "What is X" and "how to X" queries are exactly the informational searches where AIO prevalence and zero-click risk peak.
- Glossary and definition pages: high exposure and high citation potential. Concise definitions are precisely what AI Overviews lift, so these pages lose direct clicks but can win citations.
- Comparison and alternatives pages: high exposure. "Best [category] tools" and "[competitor] alternatives" queries trigger AIO often, and structured comparison tables are strong citation candidates.
- Category pages: moderate exposure, depending on how informational the query is.
- Feature pages: lower exposure when the query is productized or branded.
- Integration pages and docs: lower trigger exposure, but notable citation potential. SaaS brands sometimes earn AIO citations from authoritative docs or integration pages that don't rank top three for the main keyword.
Action for content teams: separate your defensive and offensive moves. Pages most exposed to CTR loss (blog, glossary) need extractable structure so that if you lose the click you at least win the citation. Pages with citation upside (comparison, docs, integrations) deserve investment in clarity and accuracy, because they can surface even without top rankings. For the strategic context, see Slate on how Google AI Overviews impact SEO traffic and AI Overviews impact on organic traffic statistics.
What These AI Overview Statistics Mean for SEO Teams in 2026
Track visibility beyond rankings, watch citation presence, segment queries by intent, and prioritize pages that are both traffic-critical and answer-friendly. The aim is to rank well while also being easy for AI systems to extract and cite.
The data points to a clear reordering of priorities. With citation overlap with the top 10 fallen below 54% and informational CTR down by half, the old assumption that ranking well brings the clicks no longer holds on a growing share of queries.
Three operational changes follow from the numbers:
Content architecture for extractability. AI Overviews lift clear, self-contained answers. There's no large-sample causal study proving "add an FAQ, gain X% citations," so treat extractability as an evidence-aligned best practice with no guarantee attached. In practice, the block types most consistently surfaced are concise definitions, FAQs, step-by-step instructions, and comparison tables. Build these into the pages that target informational and question-led queries.
Internal linking for citation discovery. If a page outside the top 10 can be cited, helping AI systems find and connect your most extractable answers across a topic surface counts for more than it did under a pure-ranking model.
Refresh prioritization. With limited time, update the pages that are both traffic-critical and high-exposure first (informational hubs, glossaries, and comparison pages), using content refresh tools that scale instead of ad-hoc rewrites.
What this means for marketing teams: treat visibility as a system with its own measurement layer. Most traffic dips need that lens before you assume the cause is algorithmic. For deeper frameworks, see Slate on Google AI Overviews impact on SEO in 2025 to 2026 and the Google AI Overviews SEO traffic statistics checklist.
What Marketing Teams Should Track Now (Beyond Rankings)
Measure AI Overview presence, citation share, CTR changes on affected queries, zero-click exposure, and content refresh velocity. Traditional rank tracking alone misses big visibility moves when answers get resolved on the SERP.
A rank report that shows "position 1, stable" can sit on top of a query that lost half its clicks to an AI Overview. That blind spot is why measurement has to expand. For teams building out this layer, Slate's guide to the best AI citation tracking tools covers the options.
Metric | Why it counts | Owner | Reporting cadence |
| AI Overview presence | Flags which queries carry suppression risk | SEO lead | Weekly |
| Citation share | Tracks the visibility layer rankings miss | SEO / content lead | Weekly |
| CTR delta on affected queries | Isolates AIO impact from rank changes | Analyst | Weekly |
| Zero-click exposure | Quantifies queries resolved on the SERP | Analyst | Monthly |
| Content refresh velocity | Measures how fast you can respond | Content ops | Monthly |
Track presence, citation share, and CTR delta weekly because they move with Google's tuning. Track zero-click exposure and refresh velocity monthly as trend indicators. When reporting to leadership, lead with the business framing: how much of your traffic-critical query set is now exposed to AI resolution, where you're gaining or losing citation share, and how fast the team can update high-exposure pages. That's the move from a rank-tracking mindset to a system of action. For ongoing benchmarks, see the latest AI Overview statistics, the AI Overview statistics for 2026 tooling overview, and Slate's Google AI Overviews usage and traffic data guide.
AI Overviews Are One Surface in a Bigger AI Discovery Picture
AI Overviews are the most measurable AI answer surface, but they aren't the only one. Treating them in isolation understates how fragmented discovery has become.
AI Overviews live inside classic Google Search and reach about 2 billion monthly users. AI Mode is a separate, opt-in conversational interface with 100 million plus monthly active users, a different surface with different metrics that should never be folded into AIO prevalence figures. Alongside them sit ChatGPT, Perplexity, and Gemini, each making its own citation decisions.
Attribution gets harder as more answers resolve on-platform, which makes click economics harder to interpret. Open data on cross-platform citation overlap is still thin. High-authority domains appear to get reused across surfaces, but no solid public dataset quantifies that overlap yet.
The practical takeaway holds steady: the brands that show up across surfaces are the ones with clear, consistently structured answers across a topic. That's a content-engineering problem more than a per-platform trick.
Ready to measure AI search visibility as its own layer? Slate helps teams track AI Overview presence, citation share, and CTR moves, then act on them with refresh workflows that scale. Book a demo.
Frequently Asked Questions
What Are Google AI Overviews?
Google AI Overviews are AI-generated summaries that appear within standard Google Search results, pulling together an answer to a query above or alongside the classic blue links. They count for marketers because they can resolve a query right on the SERP, which changes both click-through behavior and which pages earn visibility through citation. Google's own documentation on how AI Overviews work describes the eligibility criteria and technical controls.
How Common Are AI Overviews in 2026?
Across major 2025 to 2026 studies, AI Overviews appear on roughly 15% to 25% of all Google searches in conservative mixed-intent datasets and up to 48% to 50% in industry-specific or informational-heavy panels. Prevalence runs highest on informational and question-based queries and varies by country, device, and query sample, so the right benchmark depends on your own query mix.
Do AI Overviews Reduce Click-Through Rate?
Yes. Multiple 2025 to 2026 studies show large organic CTR declines when AI Overviews appear, often in the 34% to 61% range, with position 1 clicks down around 58% in some datasets. The exact impact depends on query type, device, and whether your brand is cited inside the AI answer, and cited results tend to hold up far better than uncited ones.
Do AI Overviews Increase Zero-Click Searches?
Yes. Research links AI Overviews with higher zero-click behavior, with some 2026 datasets reporting around 60% to 83% of AI Overview searches ending without a click. User panels also show higher session-ending rates when an AI summary is present. The effect is strongest on informational queries where Google resolves most of the answer on the page.
Where Do Google AI Overviews Get Their Citations?
AI Overviews draw citations from both top-ranking pages and pages outside the traditional top 10. Early Ahrefs-based studies showed around 76% overlap with the organic top 10 in mid-2025, but by early 2026 that overlap fell to between 17% and 54%, meaning many cited sources sit outside the highest-ranking blue links.
Are AI Overview Citations the Same as Organic Rankings?
No, not always. Citation overlap with the organic top 10 fell from about 76% in mid-2025 to between 17% and 54% in early 2026, depending on the query set. A page can be cited inside the AI answer even when it isn't the highest-ranking organic result for that keyword, which is why citation presence deserves tracking as its own visibility layer.
Why Do AI Overview Statistics Conflict Between Studies?
Differences usually come from query sampling, geography, device mix, measurement date, and whether the source tracked AI Overviews only or mixed in AI Mode and broader AI traffic. For example, one 21.9 million query study found 25% coverage with a January 2026 peak of 47%, while another found coverage settling at 15.69% by November 2025. Always check what a study counted before comparing percentages.
How Should B2B SaaS Marketing Teams Respond to AI Overviews?
Start by segmenting queries by intent and AIO presence, then track citation status as a KPI alongside rankings. Prioritize the most exposed page types (blog, glossary, and comparison or alternatives pages) and rebuild them with extractable structure: clear definitions, FAQs, steps, and comparison tables. Report AI search visibility as a separate layer instead of relying on rank tracking alone.